On this page
Statisticians decide who is poor by agreeing on a rule in advance: price a minimum standard of living, then count who falls below it. Where the line sits decides how many poor people a country reports.
What is a poverty line?
A poverty line is the money a person needs each day or month to cover a minimum basket of food, clothing, shelter and other basics. According to the World Bank's June 2025 factsheet on global poverty lines, a national line usually marks the amount below which a person's minimum nutritional, clothing and shelter needs cannot be met in that country.
Low-income countries typically build their national lines with a cost-of-basic-needs approach: price a food basket matching what people actually eat, then add an estimate for non-food spending, the same factsheet says.
India's money-based lines measure spending, not income: income estimates are unavailable, so such measures often rely on consumption expenditure, a NITI Aayog discussion paper notes.
How is India's poverty line decided?
India's official lines for 2011-12 came from a household consumption survey. The National Sample Survey Office (NSSO) tabulated the spending of about 1.20 lakh households and divided each household's spending by its number of members to get monthly per capita consumption expenditure, or MPCE, according to the Planning Commission's July 2013 press note.
The Planning Commission then applied the method of an expert group chaired by Prof. Suresh Tendulkar. Under that method, the 2011-12 poverty line was ₹816 per person per month in rural areas and ₹1,000 in urban areas, the press note says. For a family of five, that is about ₹4,080 and ₹5,000 a month.
By this line, 21.9% of Indians were poor in 2011-12, down from 37.2% in 2004-05. State lines differ because prices differ. After representations that the line was too low, an expert group under Dr C. Rangarajan was set up in June 2012 to review the method.
How is the international poverty line of $3 a day set?
In 1990, researchers converted the national lines of some of the poorest countries into a common currency and found six of them at about $1 a day in 1985 prices, the World Bank factsheet explains.
The World Bank's international poverty line is now $3.00 per person per day, measured in 2021 international dollars. It replaced the $2.15 line in June 2025. The conversion uses purchasing power parities (PPPs), which price a standard basket in every country so currencies can be compared at equal buying power. The line rose by some 40%, more than price changes alone explain, largely because low-income countries revised their national lines upward. On this line, about 838 million people lived in extreme poverty in 2022.
For India, the World Bank's October 2026 Poverty and Equity Brief reports that the share of people below $3.00 a day fell from 27.1% in 2011 to 2.6% in 2023.
What is India's multidimensional poverty index?
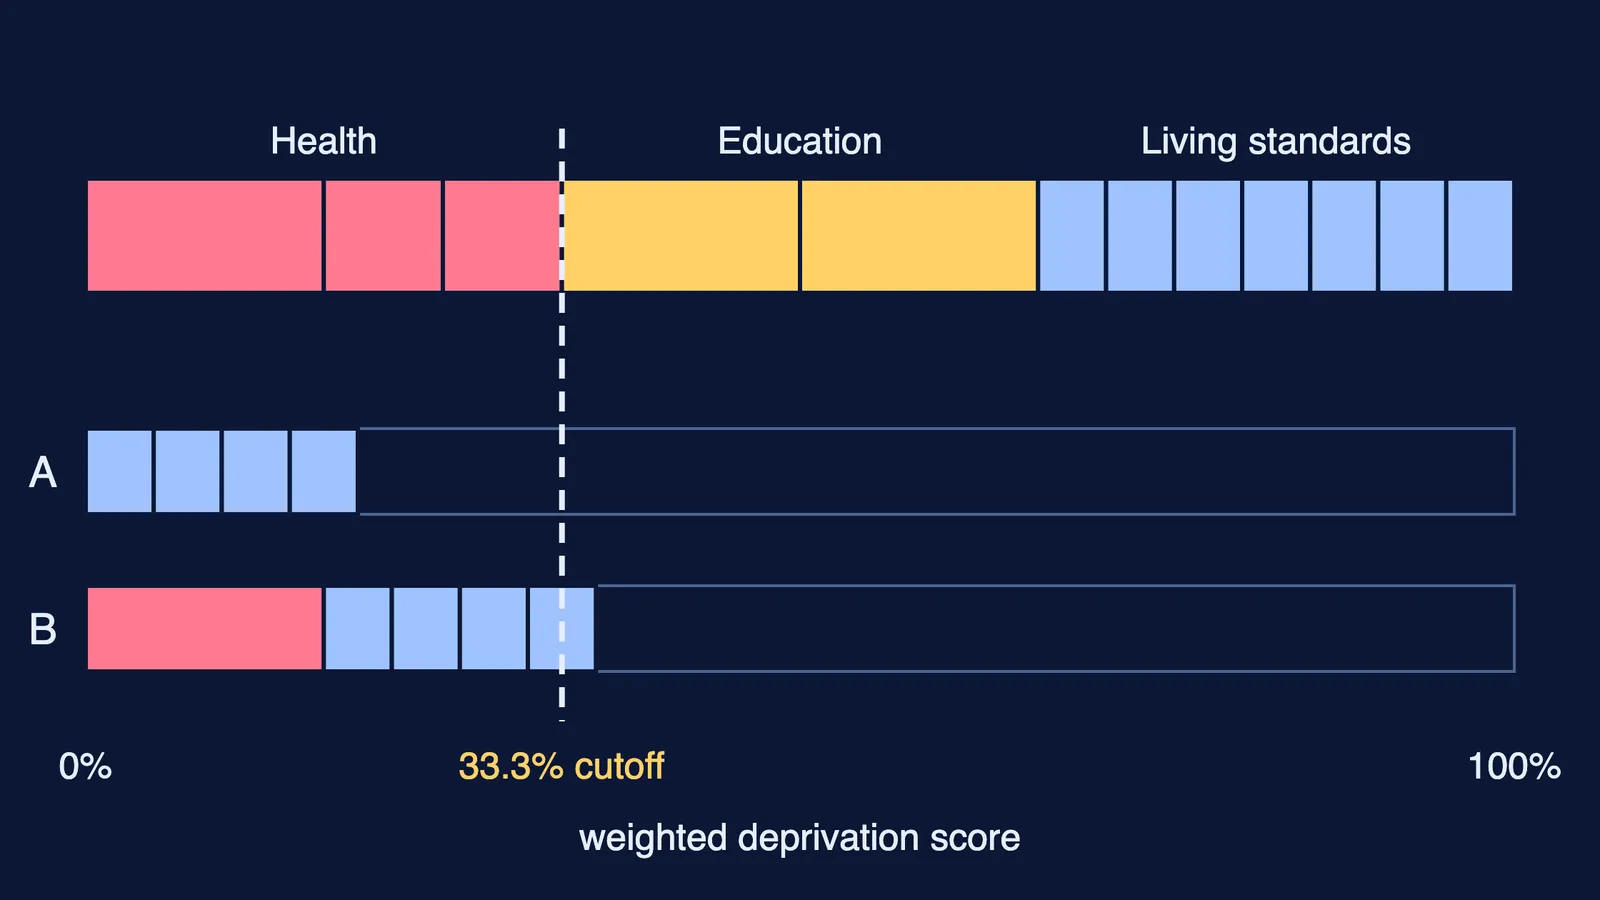
NITI Aayog's National Multidimensional Poverty Index has three equally weighted dimensions, health, education and standard of living, measured through 12 indicators, according to its 2023 progress review. The weights are:
Health (1/3): nutrition 1/6, child and adolescent mortality 1/12, maternal health 1/12
Education (1/3): years of schooling 1/6, school attendance 1/6
Standard of living (1/3): 1/21 each for cooking fuel, sanitation, drinking water, housing, electricity, assets, and bank account
A person counts as multidimensionally poor when their weighted deprivation score is 33.33% or more, the review says. On this measure, 14.96% of Indians were poor in 2019-21, down from 24.85% in 2015-16. NITI Aayog's discussion paper projected 11.28% for 2022-23, a figure extrapolated from the earlier trend rather than measured in a new survey.
Worked example: is a household poor on the MPI?
Family A lacks clean cooking fuel, sanitation, decent housing and assets.
Each of those weighs 1/21, so A scores 4/21 ≈ 0.190, or 19.0%.
That is below 33.33%, so A is not counted as poor.
Family B has the same four gaps plus a nutrition deprivation, weighing 1/6 ≈ 0.167.
B scores 0.190 + 0.167 = 0.357, or 35.7%, so B is counted as poor.
One heavily weighted indicator moved B across the line. If weighted averages like these feel shaky, the Fermi Concept Library has a lesson on each mathematics concept, with its place in the map.
How do you read a poverty headline?
Before sharing a poverty number, ask:
Is it a money line or a multidimensional index?
Which line, in which year's prices? A $2.15 figure (2017 PPP) is not directly comparable with a $3.00 one (2021 PPP).
Was it measured in a survey, or projected from a trend?
Does it split rural, urban and states? Averages hide gaps.
The same basket logic sits behind a samosa price index for inflation; see also what GDP means, with India's numbers and how India's census counts people. To check your working on a statistics problem, the Fermi Problem Library has a step-by-step solver that explains the reasoning rather than printing an answer.