On this page
In an ordinary titration you watch for a colour change. A potentiometric titration replaces your eyes with a voltmeter. After each addition you record the emf of a cell made from two electrodes in the flask, and the end point shows up as a jump on the graph.
What is a potentiometric titration?
You need two electrodes. The indicator electrode responds to the ions being titrated. In a redox titration it is typically a platinum (Pt) electrode, paired with a reference electrode, as described in Harvey's Analytical Chemistry 2.1 chapter on redox titrations/09%3A_Titrimetric_Methods/9.04%3A_Redox_Titrations). The reference electrode's potential stays fixed, so any change in the measured emf comes from the solution.
Hach's Titration Theory and Practice guide puts it simply: plot the indicator electrode's potential against the volume added, and you get an S-shaped curve whose inflection point is the equivalence point. In acid-base titrations the indicator electrode is usually a glass electrode that reads pH.
Why does the emf jump at the equivalence point?
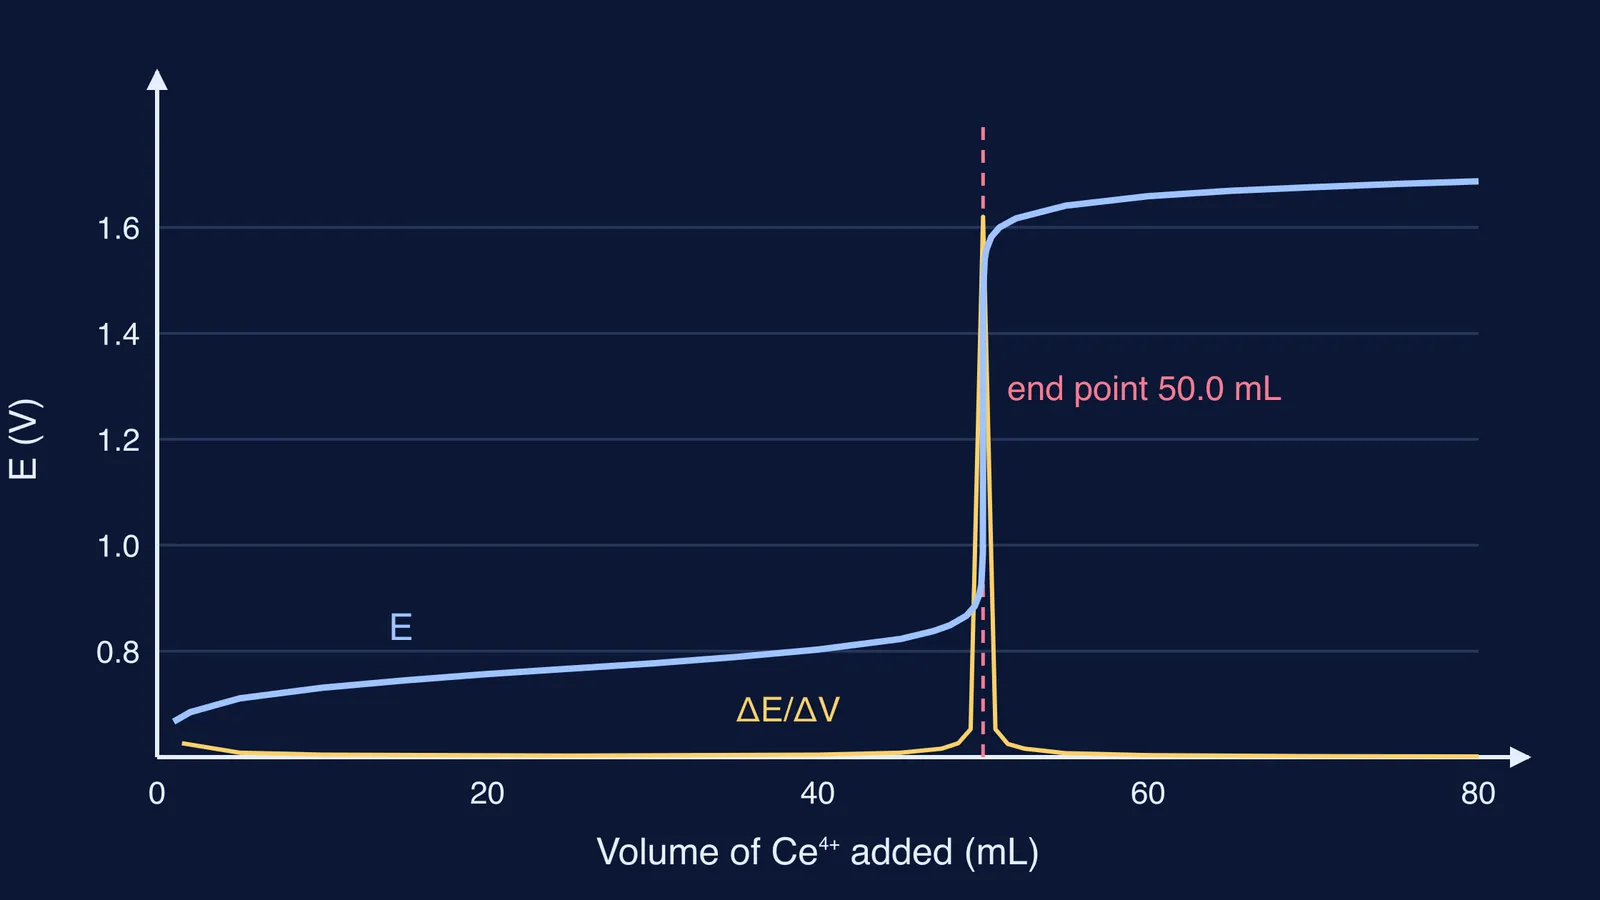
Here is the example worked in Harvey's redox chapter/09%3A_Titrimetric_Methods/9.04%3A_Redox_Titrations): 50.0 mL of 0.100 M Fe2+ titrated with 0.100 M Ce4+ in 1 M HClO4. Before the equivalence point, the Fe3+/Fe2+ ratio sets the electrode potential through the Nernst equation, E = E°′ − (0.05916/n) log([Fe2+]/[Fe3+]), with a formal potential of +0.767 V. After the equivalence point, the Ce4+/Ce3+ couple takes over, with a formal potential of +1.70 V.
That log term is what gives the curve its shape. Between 10.0 mL and 40.0 mL, the Fe3+/Fe2+ ratio goes from 1:4 to 4:1, yet Harvey's potentials rise only from +0.731 V to +0.803 V. Near 50.0 mL the last of the Fe2+ is used up and the ratio swings through several powers of ten. The potential leaps to +1.23 V at the equivalence point and reaches +1.66 V by 60.0 mL. It is the same Nernst equation behind the E cell against log Q graph.
How do you find the end point from the first derivative?
The end point is the steepest part of the curve. Harvey's acid–base titrations chapter/09%3A_Titrimetric_Methods/9.02%3A_AcidBase_Titrations) explains why: the slope is greatest at the inflection point, so the first derivative shows a spike at the equivalence point. You estimate the derivative as ΔE/ΔV between two successive readings and plot it against the average of the two volumes.
We calculated these readings from the Nernst equation with Harvey's formal potentials/09%3A_Titrimetric_Methods/9.04%3A_Redox_Titrations). Measuring against a real reference electrode shifts every reading by the same amount but leaves the shape unchanged.
48.0 mL: 849 mV
49.0 mL: 867 mV
49.5 mL: 885 mV
50.5 mL: 1582 mV
51.0 mL: 1599 mV
52.0 mL: 1617 mV
Now work out ΔE/ΔV for each pair:
48.0 to 49.0 mL: 18 mV ÷ 1.0 mL = 18 mV/mL, plotted at 48.5 mL.
49.0 to 49.5 mL: 18 mV ÷ 0.5 mL = 36 mV/mL, plotted at 49.25 mL.
49.5 to 50.5 mL: 697 mV ÷ 1.0 mL = 697 mV/mL, plotted at 50.0 mL.
50.5 to 51.0 mL: 17 mV ÷ 0.5 mL = 34 mV/mL, plotted at 50.75 mL.
51.0 to 52.0 mL: 18 mV ÷ 1.0 mL = 18 mV/mL, plotted at 51.5 mL.
The largest value comes at 50.0 mL, so that is the end point, and it matches the stoichiometry. In step 2 the emf change is the same as in step 1, but over half the volume, so the slope doubles. When your additions are uneven, always divide by ΔV.
Why does potentiometric titration work for coloured solutions?
Hach's titration guide says plainly that colour indicators cannot be used in coloured solutions or in samples with high suspended matter, and that colour changes depend on individual perception. An electrode does not read colour. It responds to ion concentrations through the Nernst equation, so a dark or cloudy sample does not hide the jump the way it hides an indicator's colour change.
Potassium permanganate can act as its own indicator in KMnO4 titrations in a clear solution, but in a flask that is already coloured, a faint pink tinge is hard to see. There the emf jump is the more reliable signal.
What should you write in the lab record or exam?
Label the axes: emf (mV or V) on the y-axis, titrant volume (mL) on the x-axis.
Mark the steepest part of the S-curve as the end point.
In a ΔE/ΔV table, plot each value at the average of its two volumes.
Read the end point at the peak of ΔE/ΔV, or where the second derivative crosses zero.
When asked why it works, say that the reference potential stays constant while the indicator electrode follows the Nernst log term.
If graph questions like this trip you up, the Fermi Problem Library has worked problems with a step-by-step solver that explains the reasoning instead of just printing an answer. If the Nernst equation itself still feels shaky, start with the Fermi Concept Library.