
On this page
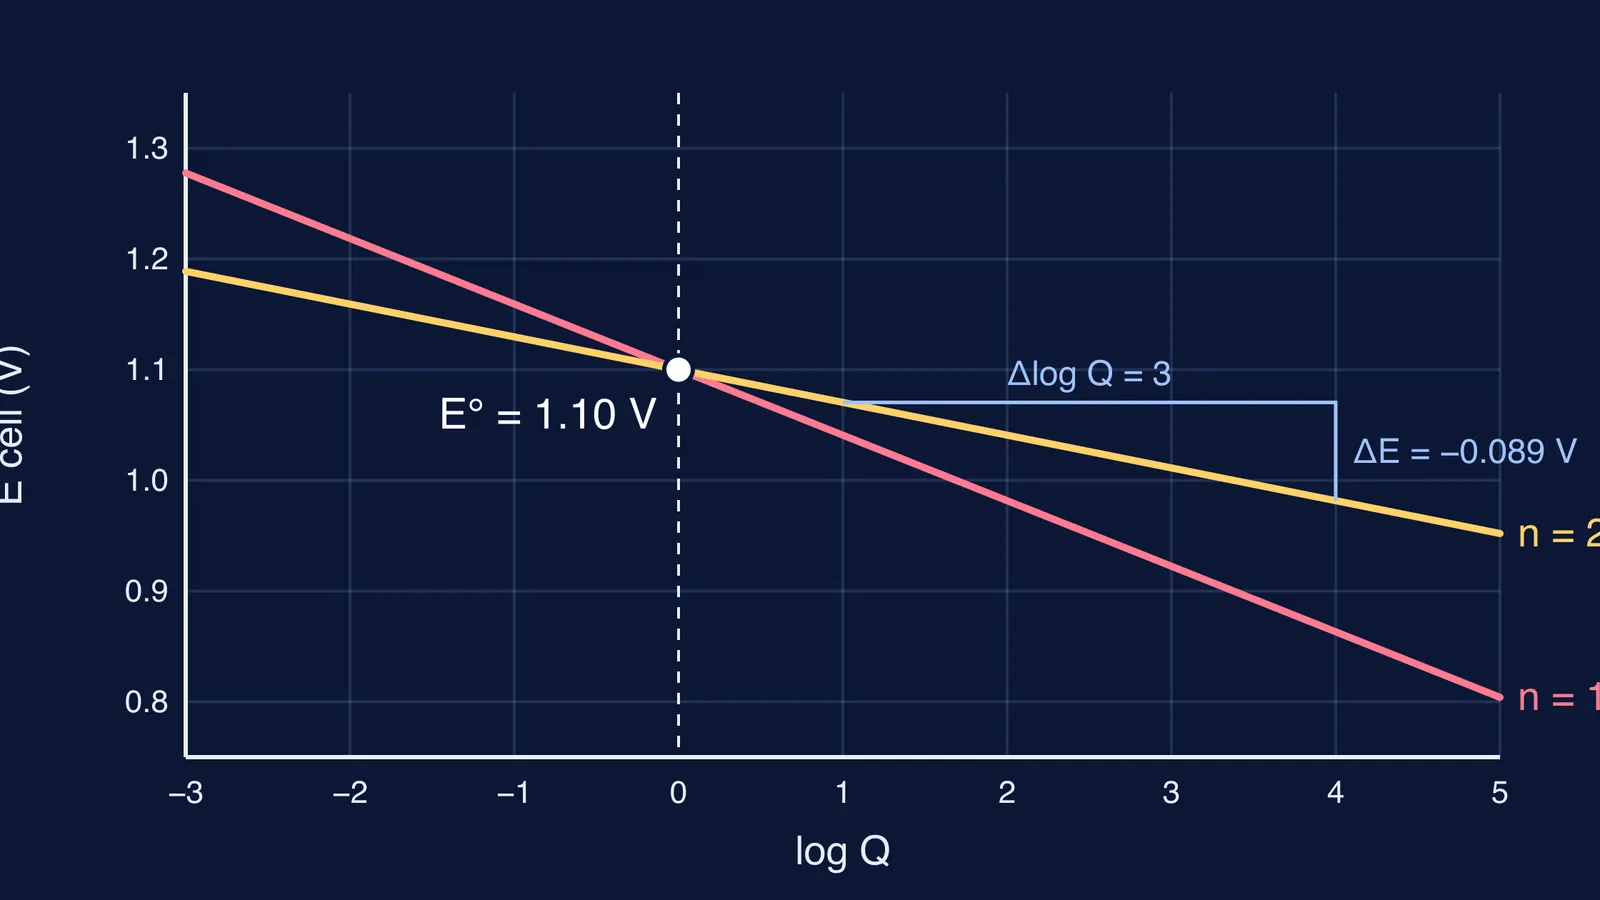
Electrochemistry questions love one graph: cell potential on the y-axis, log Q on the x-axis. It looks like a data question, but it is really the Nernst equation drawn as a line. Once you see that, two numbers fall straight out of the picture:the number of electrons n and the standard cell potential E°.
Why is the graph of E cell against log Q a straight line?
The general Nernst equation is E = E° − (RT/nF) ln Q. Switching to base-10 logs turns that into E = E° − (2.303 RT/nF) log Q, and at 298 K the constant becomes 0.0592 V, according to Chemistry LibreTexts/Electrochemistry/Nernst_Equation). That gives the form you meet in Class 12:
E cell = E° − (0.0592 V/n) log Q
Compare it with y = c + mx. Put y = E cell and x = log Q, and everything else is a constant at a fixed temperature. So:
the slope m is −0.0592/n volts per unit of log Q
the y-intercept c, where log Q = 0, is E°
the line falls from left to right, because as products build up Q rises and the cell has less push left
If you want to know where the 0.0592 comes from, we have a separate post on where 0.059 in the Nernst equation comes from, and another on how to derive the Nernst equation from Gibbs energy.
How do you find n from the slope?
Pick two points on the line that sit on clear grid crossings, far apart. Then:
Work out the slope: (E2 − E1) / (log Q2 − log Q1). It should come out negative.
Set it equal to −0.0592/n.
Solve: n = 0.0592 / |slope|.
Round to a whole number. n counts electrons, so 1.98 means 2.
A steeper line means a smaller n. Using the 0.0592 V/n coefficient from Lumen Learning's Nernst equation page, a one-electron reaction loses about 0.059 V for every tenfold rise in Q; a two-electron reaction loses about half that.
How do you read E° from the intercept?
E° is the value of E cell on the line at log Q = 0, which means Q = 1. Lumen Learning's chemistry text puts it directly: when Q = 1, the cell potential equals the standard cell potential.
Watch the axes. If the x-axis starts at, say, log Q = 1, the line never touches the y-axis at log Q = 0 and the value where it meets the left edge is not E°. Extend the line back, or use any point and rearrange: E° = E + (0.0592/n) log Q.
Worked example: a Daniell cell graph
For the zinc–copper cell, Zn + Cu²⁺ → Zn²⁺ + Cu, Chemistry LibreTexts/Electrochemistry/Nonstandard_Conditions:_The_Nernst_Equation) gives E° = +1.10 V with n = 2, and works out that with [Zn²⁺] = 5.0 M and [Cu²⁺] = 0.05 M the cell potential drops to 1.04 V.
Turn that into a graph question. Suppose the line passes through (log Q = 0, E = 1.10 V) and (log Q = 2, E = 1.04 V). The second point is the LibreTexts case, since Q = 5.0/0.05 = 100.
Slope = (1.04 − 1.10) / (2 − 0) = −0.030 V.
n = 0.0592 / 0.030 = 1.97, so n = 2. That matches two electrons moving from zinc to copper.
E° = the intercept at log Q = 0 = 1.10 V.
Bonus: the line would cross E = 0 at log Q = log K. Using log K = nE°/0.0592 from the LibreTexts Nernst page/Electrochemistry/Nernst_Equation), log K = 2 × 1.10 / 0.0592 ≈ 37. That is why you never see this line reach the x-axis on a printed graph: it hits zero far off the page.
That last point is the same idea behind why a galvanic cell eventually stops: E falls along this line until Q reaches K and the cell has nothing left to give.
What traps do exam questions set on this graph?
ln instead of log. With natural logs the coefficient at 298 K is 0.0257 V/n, not 0.0592 V/n, as Lumen Learning shows. Check the axis label before you divide.
Flipped x-axis. If the axis is log([reactant]/[product]), that is log(1/Q), and the slope turns positive. The size of the slope still gives n.
A different temperature. 0.0592 V holds at 298 K. The general term is 2.303 RT/nF, so the size of the slope grows in proportion to T.
Fractional n. If you get 1.5, recheck your two points.
If you get the slope right but the n wrong, practise a few of these in the Fermi Problem Library, where the step-by-step solver explains the reasoning rather than printing an answer. If the Nernst equation itself still feels shaky, the Fermi Concept Library gives each chemistry concept its own lesson and its place in the map, so you can see how it connects to Gibbs energy and equilibrium.