On this page
You toss a coin and get 15 heads out of 20. Is the coin rigged, or did you just get lucky? A p-value is the tool scientists use for exactly this question, and it is easy to misread. Here is how to read one, and work one out by hand.
What does a p-value actually mean?
Every test starts with a dull assumption called the null hypothesis: the coin is fair, the medicine does nothing.
A p-value is the probability of getting data at least as extreme as yours if the null hypothesis were true.
A small p-value means your data would be surprising in a world where nothing is going on. The first principle of the American Statistical Association’s 2016 statement on p-values says: “P-values can indicate how incompatible the data are with a specified statistical model.” A p-value measures surprise, not truth.
How do you calculate a p-value? A coin-toss example
Here is that definition from the ASA statement applied to our coin.
State the null hypothesis. The coin is fair: each toss lands heads with probability 1/2.
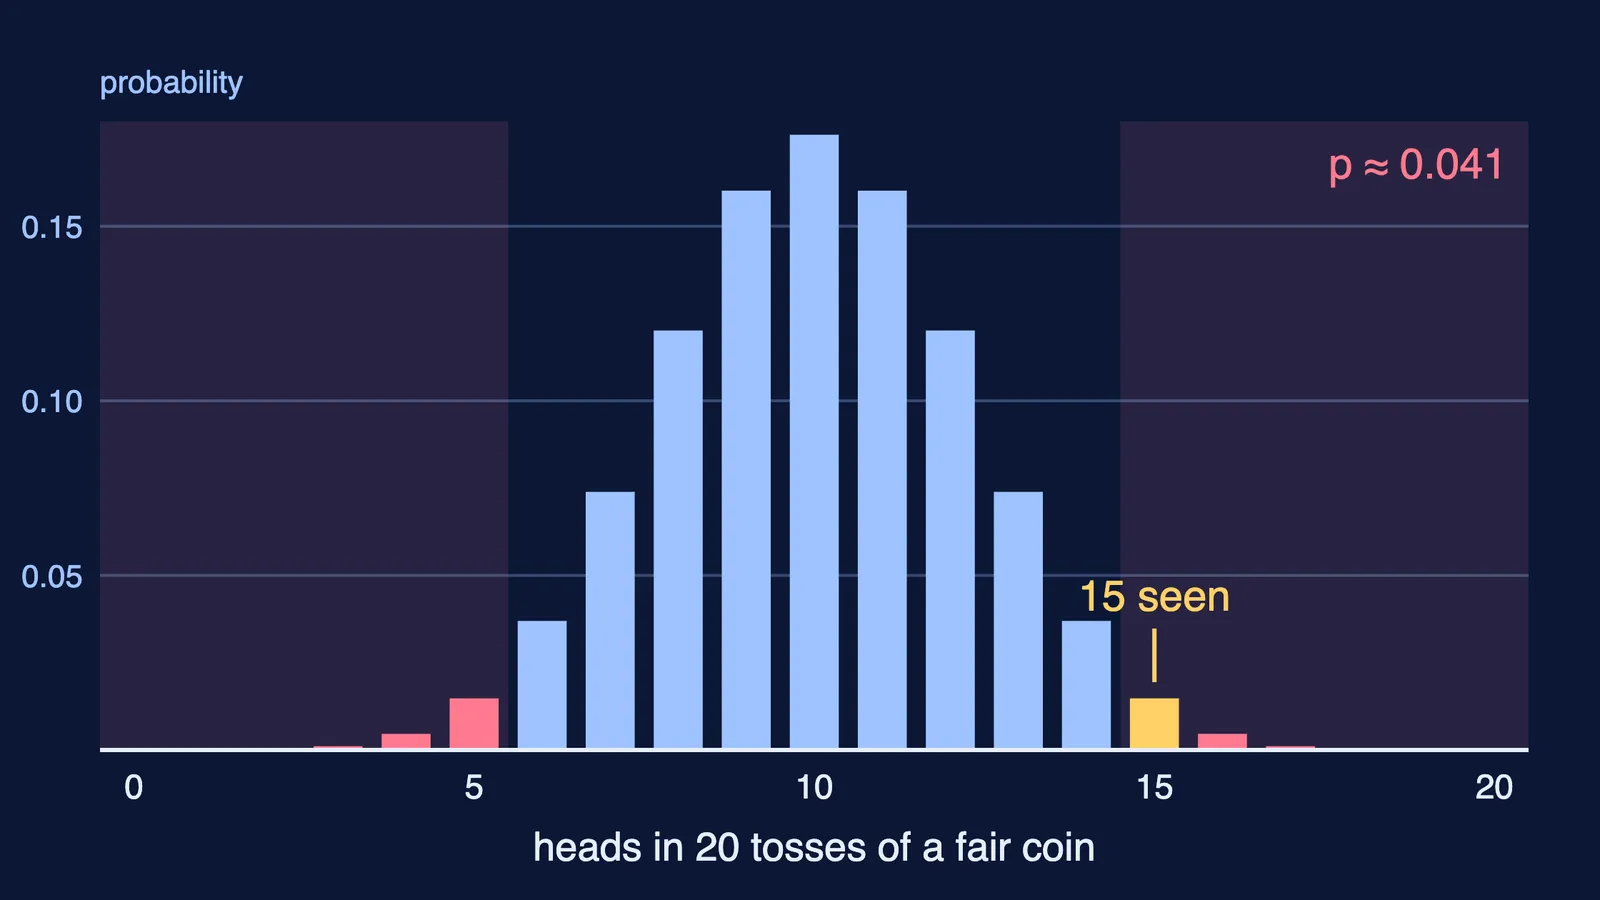
Decide what counts as “at least as extreme”. We saw 15 heads. A coin biased towards tails would be just as interesting, so 5 or fewer heads counts too. This is a two-sided test.
Count. There are 2²⁰ = 1,048,576 equally likely sequences of 20 tosses. The binomial coefficients C(20,15) to C(20,20) give 15,504 + 4,845 + 1,140 + 190 + 20 + 1 = 21,700 sequences with 15 or more heads, so one tail is 21,700 ÷ 1,048,576 ≈ 0.0207.
Double it for both tails. p ≈ 2 × 0.0207 ≈ 0.041.
So if the coin were fair, a result this lopsided would turn up about 4 times in every 100 runs of 20 tosses.
Now redo it with 14 heads. The count grows to 21,700 + 38,760 = 60,460, one tail is about 0.058, and the two-sided p is about 0.115. One extra head moves the result from “significant” to “not significant”, yet the evidence has barely shifted. If the counting feels rusty, see why the binomial mean is np and the variance npq.
Why is 0.05 the cut-off for significance?
Because researchers agreed on it, not because nature did. In the press release for the 2016 statement, ASA executive director Ron Wasserstein said good statistical arguments contain “much more than the value of a single number and whether that number exceeds an arbitrary threshold.” The statement’s third principle says decisions “should not be based only on whether a p-value passes a specific threshold.”
Some researchers want a stricter line. In 2017, 72 authors wrote in Nature Human Behaviour: “We propose to change the default P-value threshold for statistical significance from 0.05 to 0.005 for claims of new discoveries.” Under that rule, our 15-heads coin would not count.
What does a p-value not tell you?
Many of the ASA’s six principles address misreadings:
Not the chance the coin is fair. p ≈ 0.041 does not mean a 4.1% chance of a fair coin. P-values “do not measure the probability that the studied hypothesis is true, or the probability that the data were produced by random chance alone.”
Not the size of the effect. Statistical significance “does not measure the size of an effect or the importance of a result.” A huge study can give a tiny p for a useless difference.
A large p is not proof of nothing. With 14 heads, 20 tosses may simply be too few to tell.
Not meaningful without the full story. “Proper inference requires full reporting and transparency.” Run 20 tests on pure noise and one may dip below 0.05 by luck.
Why do significant results fail to replicate?
The Open Science Collaboration repeated 100 psychology studies and reported the results in Science in 2015. Ninety-seven percent of the original studies had statistically significant results; 36% of the replications did.
Part of the reason is what Jessica Utts, then ASA president, called the “file-drawer effect” in the same press release: significant results are much more likely to get published. For a case study, read what the ego depletion replications found about willpower; for why small samples mislead, see Mendel’s 3:1 ratio tested with 10 plants versus 1,000.
Five questions before you trust “p < 0.05”
What was the null hypothesis, in one plain sentence?
How big was the effect, in real units?
How many people, plants or tosses were studied?
How many tests were run, and were all reported?
Has anyone repeated it and found the same thing?
When you explain a result, say “data this extreme would turn up about 4 times in 100 if nothing were going on”, not “a 4 in 100 chance it was luck”, the misreading the ASA statement warns against.
If you get stuck on a probability calculation, the Fermi Problem Library has worked problems with a step-by-step solver that explains the reasoning rather than printing an answer. The Fermi Concept Library gives every mathematics concept its own lesson.