On this page
The graphical method for the mode turns a formula you might forget into a picture you can check: steps, a worked example and a short proof.
How do you find the mode from a histogram graphically?
The Tamil Nadu Class 11 Statistics textbook (Chapter 5, Measures of Central Tendency) describes the method, reproduced on this study page of the chapter. Split into steps:
Draw a histogram of the frequency distribution.
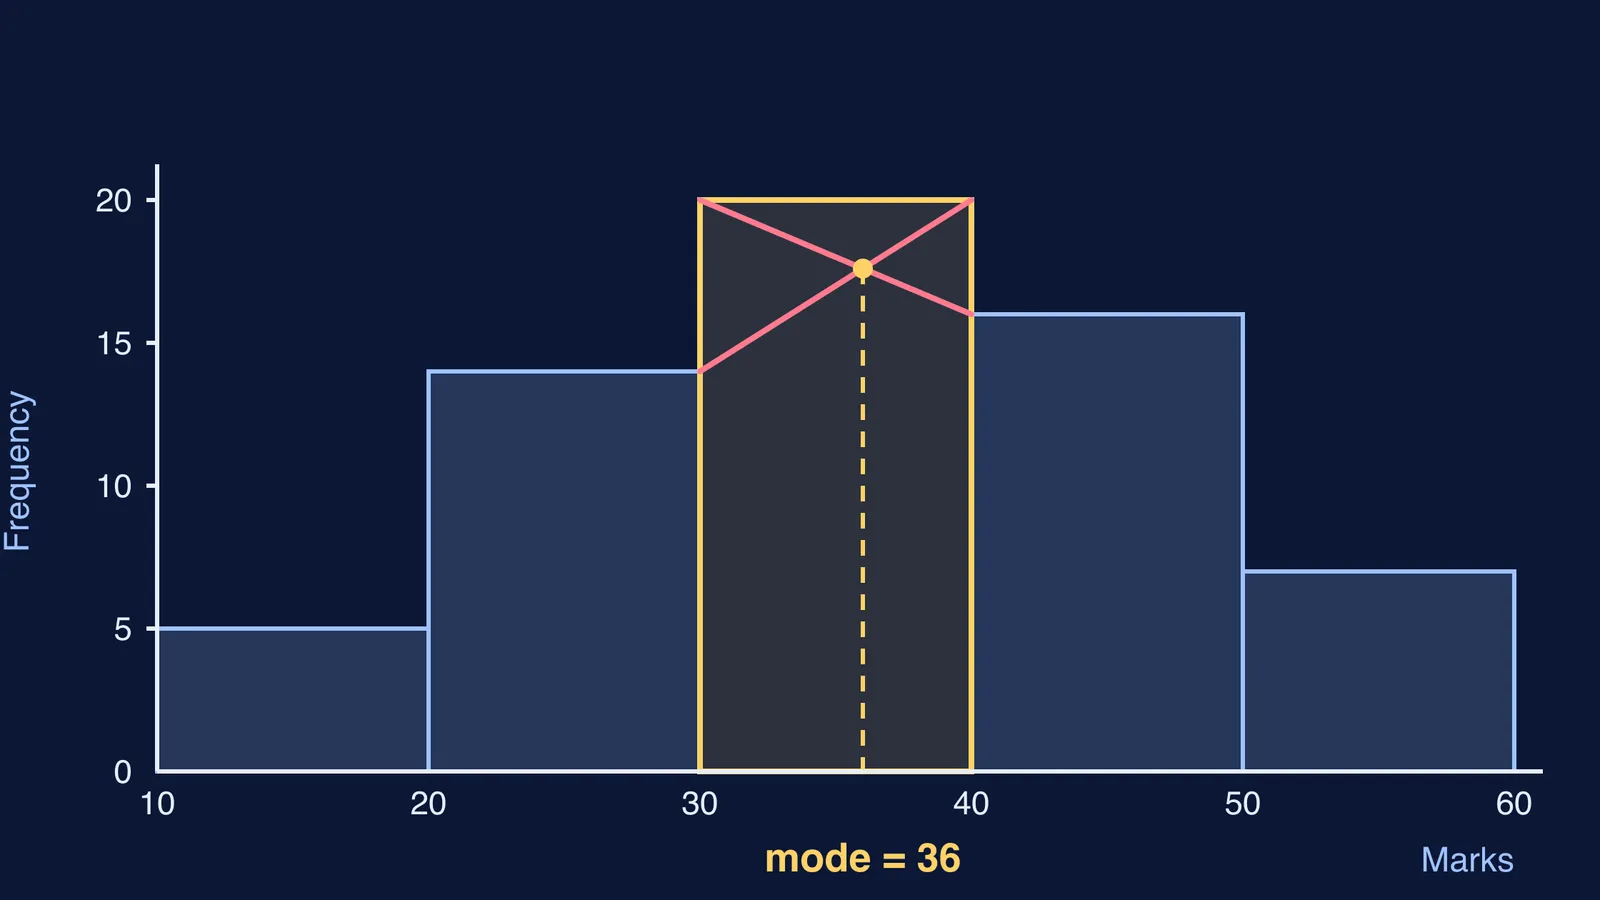
Join the top-right corner of the tallest rectangle (the modal class) to the top-right corner of the rectangle just before it.
Join the top-left corner of the tallest rectangle to the top-left corner of the rectangle just after it.
From the point where these two lines cross, draw a perpendicular to the x-axis. The x-value where it lands is the mode.
The two lines form an X inside the modal bar; if they do not, you joined the wrong corners.
The same chapter lists two limits: the mode cannot be calculated for a series with unequal class intervals, and a bimodal distribution has two modal classes, which makes the mode hard to fix (source). So use this method only when every class has the same width. Unequal widths also change how the bars are drawn, as our guide to drawing a histogram with unequal class widths shows.
A worked example: marks in a class test
Suppose a class test gives this grouped data (marks, number of students):
10 to 20: 5
20 to 30: 14
30 to 40: 20
40 to 50: 16
50 to 60: 7
For a refresher on drawing the bars, see how to draw a histogram for grouped data.
Choose a scale: 1 cm for 10 marks and 1 cm for 2 students fits easily.
Draw the five bars. The tallest is 30 to 40, with height 20. That is the modal class.
Join (40, 20), the top-right corner of the modal bar, to (30, 14), the top-right corner of the 20 to 30 bar.
Join (30, 20), the top-left corner of the modal bar, to (40, 16), the top-left corner of the 40 to 50 bar.
The lines cross at (36, 17.6). Drop a perpendicular to the x-axis.
Read the x-axis: the mode is 36 marks.
Now check it with the formula Mode = l + (f1 − f0) / (2f1 − f0 − f2) × h, where l is the lower limit of the modal class, f1 its frequency, f0 and f2 the frequencies of the classes before and after it, and h the class width. Here l = 30, f1 = 20, f0 = 14, f2 = 16 and h = 10, so Mode = 30 + 6 / 10 × 10 = 36. Our post on finding the modal class and applying the mode formula walks through it.
Why do the crossing lines give the same answer as the formula?
Look at the two gaps at the edges of the modal bar. At its left edge, the modal bar stands f1 − f0 above the bar before it: 6 in our example. At its right edge, it stands f1 − f2 above the bar after it: 4.
The crossing lines cut these gaps into two similar triangles, one on each edge. Similar triangles share the same ratio of height to width, so the crossing point divides the class width h in the ratio of the two gaps. That puts it (f1 − f0) / ((f1 − f0) + (f1 − f2)) × h from the left edge. The denominator simplifies to 2f1 − f0 − f2, which is exactly the formula. Any gap between the two answers comes from drawing and reading.
What mistakes cost marks on this question?
Joining the modal bar's top-left corner to the before-bar's top-left corner. The lines then do not cross inside the modal bar.
Using the method when class widths are unequal, which the textbook says does not work.
Reading the y-value of the crossing point. The mode lives on the x-axis.
Forgetting the edge case. If the modal class is the first or last class, treat the missing neighbour as height zero, the same as putting f0 = 0 or f2 = 0 in the formula.
Writing "36" with no unit. Write "mode = 36 marks".
If your two answers keep disagreeing, the Fermi Problem Library has worked problems with a step-by-step solver that explains the reasoning rather than printing an answer. For the ideas underneath, such as class width and the modal class, the Fermi Concept Library gives each concept its own lesson.
Next time you see "locate the mode graphically", draw the X, drop the line, and check the answer with one line of arithmetic.