On this page
A histogram looks like a bar graph, but three details decide whether you get full marks: what goes on the x-axis, whether the bars touch, and how you show that the axis jumps from 0 to your first class. Here is one example, from table to finished graph.
What is a histogram, and how is it different from a bar graph?
A histogram is a vertical bar graph with no space between the bars, used for a continuous grouped frequency distribution, as the NIOS Secondary Mathematics lesson on data defines it. Classes go along the horizontal axis and frequencies up the vertical axis.
NCERT's Class 11 Statistics for Economics chapter on presenting data explains why the bars touch: the upper boundary of one class is the lower boundary of the next, so there is no space between consecutive rectangles. A bar graph, by contrast, must leave gaps. In a histogram the width of a bar matters as much as its height, because the area of each rectangle is proportional to the class frequency.
For more examples, read our guide to bar graphs versus histograms.
How do you draw a histogram for grouped data, step by step?
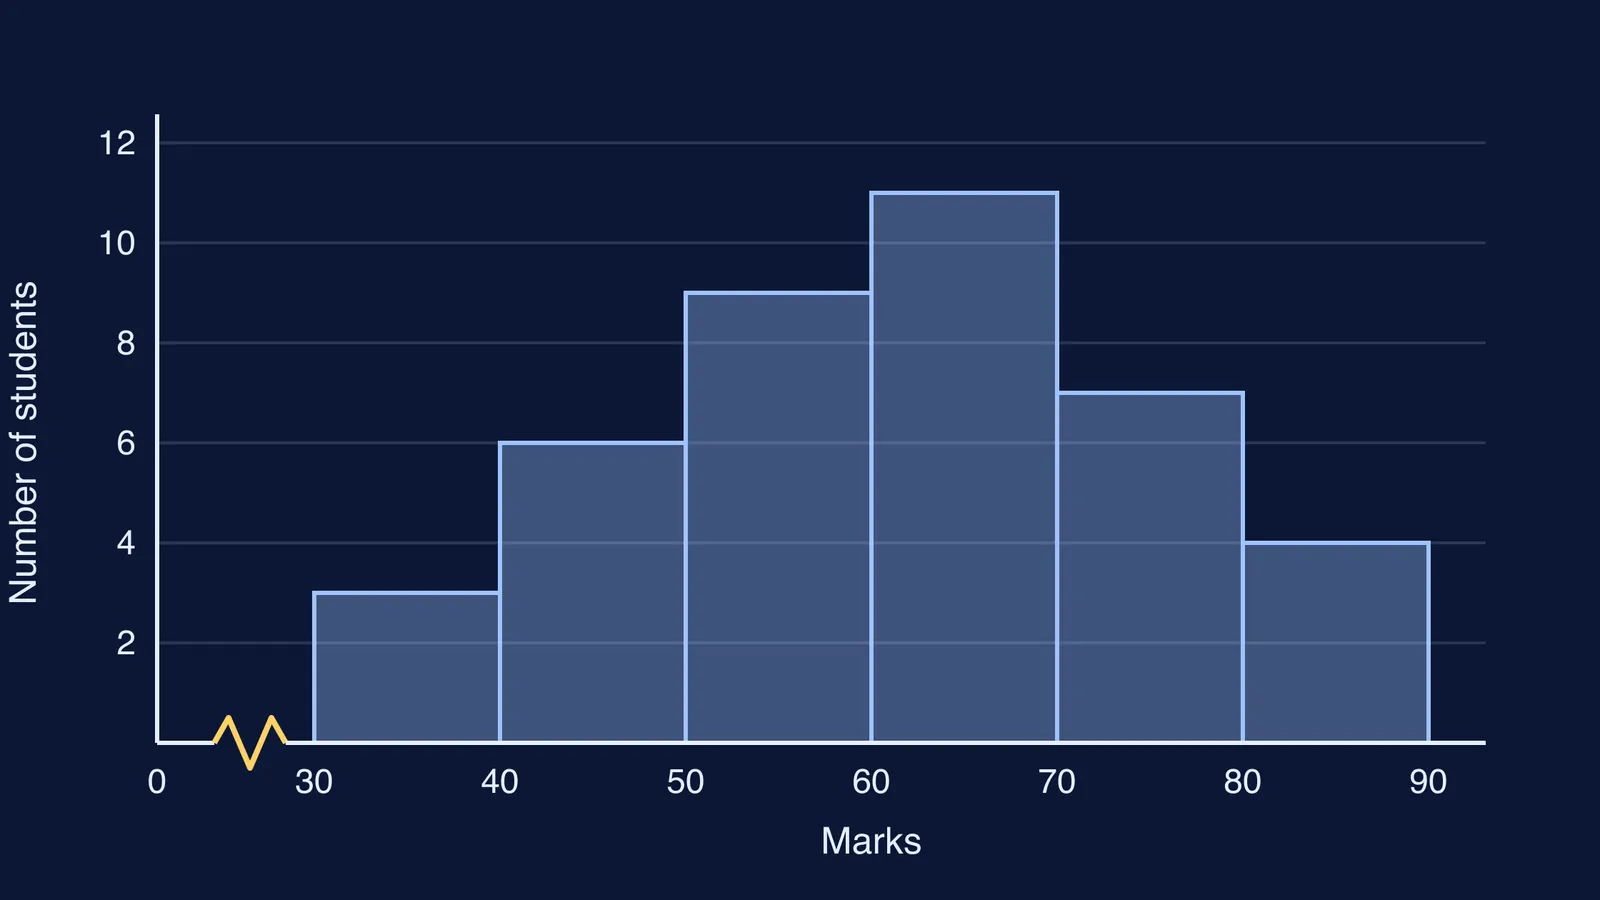
Practice data: the marks (out of 100) of 40 students in a Class 8 test.
30–40: 3 students
40–50: 6 students
50–60: 9 students
60–70: 11 students
70–80: 7 students
80–90: 4 students
Check the classes are continuous. 30–40 and 40–50 share the end point 40, so a mark of exactly 40 goes in 40–50. If your table reads 31–40, 41–50, first move each limit out by half the gap; the NCERT chapter turns its class 45–49 into 44.5–49.5 this way.
Draw the axes. Marks on the horizontal axis, number of students on the vertical axis.
Choose the scales. Give each 10-mark class 2 cm. Let 1 cm stand for 1 student, so the tallest bar is 11 cm.
Draw the kink. The first class starts at 30, so draw a small zig-zag on the x-axis between 0 and 30.
Draw the rectangles. 30–40 is 3 cm tall; 40–50 is 6 cm tall and shares its left edge with the first bar. Carry on to 80–90.
Label everything. Write 30, 40, 50 up to 90 under the bar edges, then add axis titles, the scale and a title.
Why do you need a kink when the axis does not start at zero?
With 2 cm for every 10 marks, starting the x-axis at 0 would push 30 out to 6 cm, leaving empty axis with nothing above it. Instead, begin the classes just after the origin and draw a small zig-zag, called a kink, between 0 and the first class. It tells the reader the axis has been broken and the values from 0 to 30 skipped on purpose.
Two rules keep the kink honest:
Put it on the x-axis only, between the origin and the first class boundary.
Keep the vertical axis starting at 0. If it started at 2, the bar for 3 students would look one-seventh the height of the bar for 9 instead of one-third.
The second rule matters because the NCERT Statistics for Economics chapter makes the area of each rectangle proportional to the class frequency. Cutting off the bottom of every bar breaks that link.
What if the class intervals are not the same width?
Most Class 8 questions use equal widths, but you may meet a class like 80–100 among classes of width 10. The NCERT chapter says that when widths differ, the height should be the frequency density: class frequency divided by class width.
Suppose 80–100 had 8 students. Its density is 8 ÷ 20 = 0.4 students per mark, or 4 students per 10 marks. Draw it 4 cm tall and 4 cm wide, and label the y-axis "students per 10 marks". Its area is still worth 8 students.
If you are unsure which graph a question wants, our guide to choosing between bar, line, pie charts and histograms walks through the decision. For the rest of the chapter, see pie charts and chance in Class 8.
What should you check before handing in a histogram?
The bars touch, with no gaps.
Class boundaries sit under the bar edges.
A kink is drawn if the first class does not start at 0.
The vertical axis starts at 0.
Unequal widths use frequency density.
The bar heights add up to the total: here 3 + 6 + 9 + 11 + 7 + 4 = 40.
If histogram questions keep going wrong at the same step, the Fermi Problem Library has worked problems with a step-by-step solver that explains the reasoning rather than printing an answer. If the shaky part is the idea of class boundaries itself, the Fermi Concept Library gives each concept in mathematics its own lesson.
Draw the example once on graph paper, kink and all, and the next grouped table will feel familiar.