On this page
Two numbers turn up in social science chapters, geography answers and general knowledge papers: literacy rate and sex ratio. Both depend on who is counted. Here is how India's official statistics define each one, how to calculate them, and how to read the differences between states.
How is literacy rate calculated in India?
The statistics ministry (MoSPI) sets out the definitions in its Statistical Year Book chapter on education:
A literate person is someone aged 7 years or above who can both read and write with understanding in any language.
A person who can read but cannot write is counted as illiterate.
No formal schooling is needed, and people who are blind and read Braille are counted as literate.
All children aged 6 or below are treated as illiterate, even if they go to school and can read.
Literacy rate is the percentage of literates in the population aged 7 years and above (MoSPI). As a formula: literacy rate = (literates aged 7+ ÷ population aged 7+) × 100.
The age cut-off has changed over time. MoSPI's Women and Men in India 2016 literacy chapter notes that rates for 1951 to 1971 cover people aged 5 and above, while rates from 1981 onwards cover people aged 7 and above. Old and new figures are not strictly like for like.
A worked example: one village, two answers
Take an imaginary village of 1,200 people. 150 are aged 0 to 6, so 1,050 are aged 7 or above, and 840 of those can read and write with understanding.
Literacy rate: 840 ÷ 1,050 × 100 = 80%.
Divide by the whole population instead: 840 ÷ 1,200 × 100 = 70%.
Dividing by everyone gives a crude literacy rate, a term used in the notes to Table 3.1 of MoSPI's literacy chapter. It looks worse only because small children sit in the denominator. Check the denominator before you compare two figures.
Even one official report can carry two figures. The 2016 MoSPI literacy chapter gives India's 2011 literacy rate as 74.04% (82.14% for males, 65.46% for females), while the same report's highlights give 72.98% (64.63% for females, 80.9% for males), and the report does not explain the difference. The Census of India also published provisional population totals before its final tables, so name the table and release you quote.
How is sex ratio calculated?
In India, sex ratio is the number of females per 1,000 males, as defined in MoSPI's Women and Men in India 2016 population chapter. As a formula: sex ratio = (females ÷ males) × 1,000.
A town with 5,200 females and 4,800 males has a sex ratio of 5,200 ÷ 4,800 × 1,000, which rounds to 1,083. Above 1,000 means more females than males; below 1,000 means fewer.
Census 2011 recorded a sex ratio of 943 for India, 949 in rural areas and 929 in urban areas, according to the MoSPI 2016 highlights.
The child sex ratio uses the same formula for children aged 0 to 6. India's child sex ratio in 2011 was 918, according to Table 1.4 of the MoSPI population chapter.
What do the state differences show?
All figures are Census 2011, as tabulated by MoSPI: literacy from Table 3.3 of the literacy chapter, and sex ratio from Tables 1.2 and 1.4 of the population chapter.
Kerala had the highest literacy rate of any state, 94.0%, and the highest sex ratio, 1,084.
Bihar had the lowest literacy rate of any state, 61.8%.
Haryana had the lowest sex ratio of any state, 879, and the lowest child sex ratio, 834.
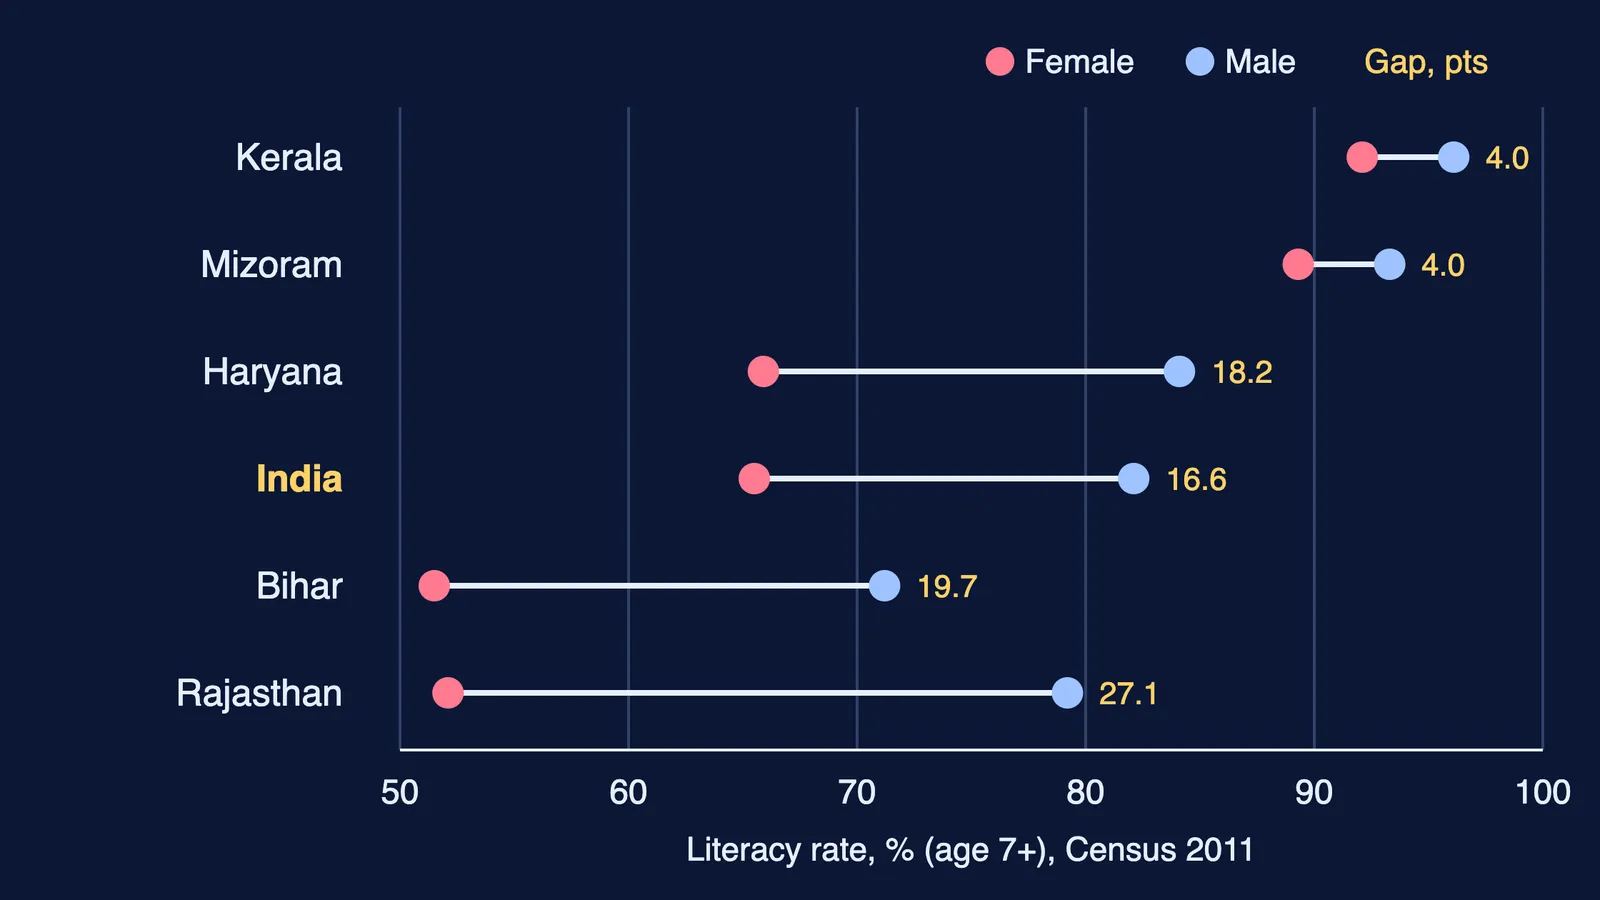
The gap between male and female literacy often says more than the total. From the same Table 3.3:
India: 82.1% of males and 65.5% of females were literate, a gap of 16.6 percentage points.
Kerala: 96.1% and 92.1%, a gap of 4.0 points.
Rajasthan: 79.2% and 52.1%, a gap of 27.1 points.
The two sex ratios can also point different ways. Kerala's overall sex ratio was 1,084, but its child sex ratio was 964, so one should never stand in for the other.
How do you read a literacy or sex ratio figure?
Before you use any figure from a textbook or news report, ask five questions:
Which year and which release is it from: provisional or final?
What is the denominator: people aged 7 and above, or everyone?
Which group: total, rural, urban, male or female?
Is it the overall sex ratio or the child sex ratio?
Am I comparing levels, or a gap in percentage points?
If you can answer all five, you can write an exact board answer and spot a misleading headline. If the ratio and percentage steps are where you slip, the Fermi Problem Library has worked problems with a step-by-step solver that explains the reasoning rather than printing an answer.
New state figures will come from the next census; our explainer on how India's census is conducted covers how the count is taken. For more on reading statistics, see what a p-value means, and for board geography, the CBSE map work list and a weekly plan.