On this page
The Human Development Index (HDI) is the United Nations Development Programme's measure of how well people live, not just how much a country earns. It turns four statistics into one number between 0 and 1, and with a calculator's ln button you can rebuild India's published value yourself.
What does the HDI measure?
UNDP's Human Development Report 2025 technical notes define the HDI as "a summary measure of achievements in three key dimensions of human development: a long and healthy life, access to knowledge and a decent standard of living." Each dimension has its own indicators:
Long and healthy life: life expectancy at birth.
Knowledge: expected years of schooling for children starting school, and mean years of schooling for adults aged 25 and over.
Decent standard of living: gross national income (GNI) per person, in 2021 purchasing-power-parity (PPP) dollars.
GNI is a close cousin of GDP, covered in our explainer on what GDP means, with India's numbers.
How is HDI calculated, step by step?
Step 1 turns each indicator into an index between 0 and 1 using fixed minimum and maximum values, which UNDP calls goalposts. The technical notes give the formula: dimension index = (actual value − minimum) ÷ (maximum − minimum). The goalposts in the 2025 notes are:
Life expectancy at birth: 20 to 85 years.
Expected years of schooling: 0 to 18 years.
Mean years of schooling: 0 to 15 years.
GNI per capita: $100 to $75,000 (2021 PPP).
Three details catch people out. The education index is the ordinary average of the two schooling indices. Income uses the natural logarithm of the actual, minimum and maximum values, because, in UNDP's words, "each additional dollar of income has a smaller effect on expanding capabilities." And income above $75,000 does not directly add to a country's HDI.
Step 2 combines the three: HDI = (health index × education index × income index)^(1/3). That is the geometric mean of the three indices.
How is India's HDI of 0.685 worked out?
UNDP's HDR 2025 data file gives India's 2023 figures: life expectancy of 72.0 years, expected schooling of 12.95 years, mean schooling of 6.88 years and GNI per capita of about $9,047 (2021 PPP). Here is the calculation, carrying four decimals where rounding would shift the answer:
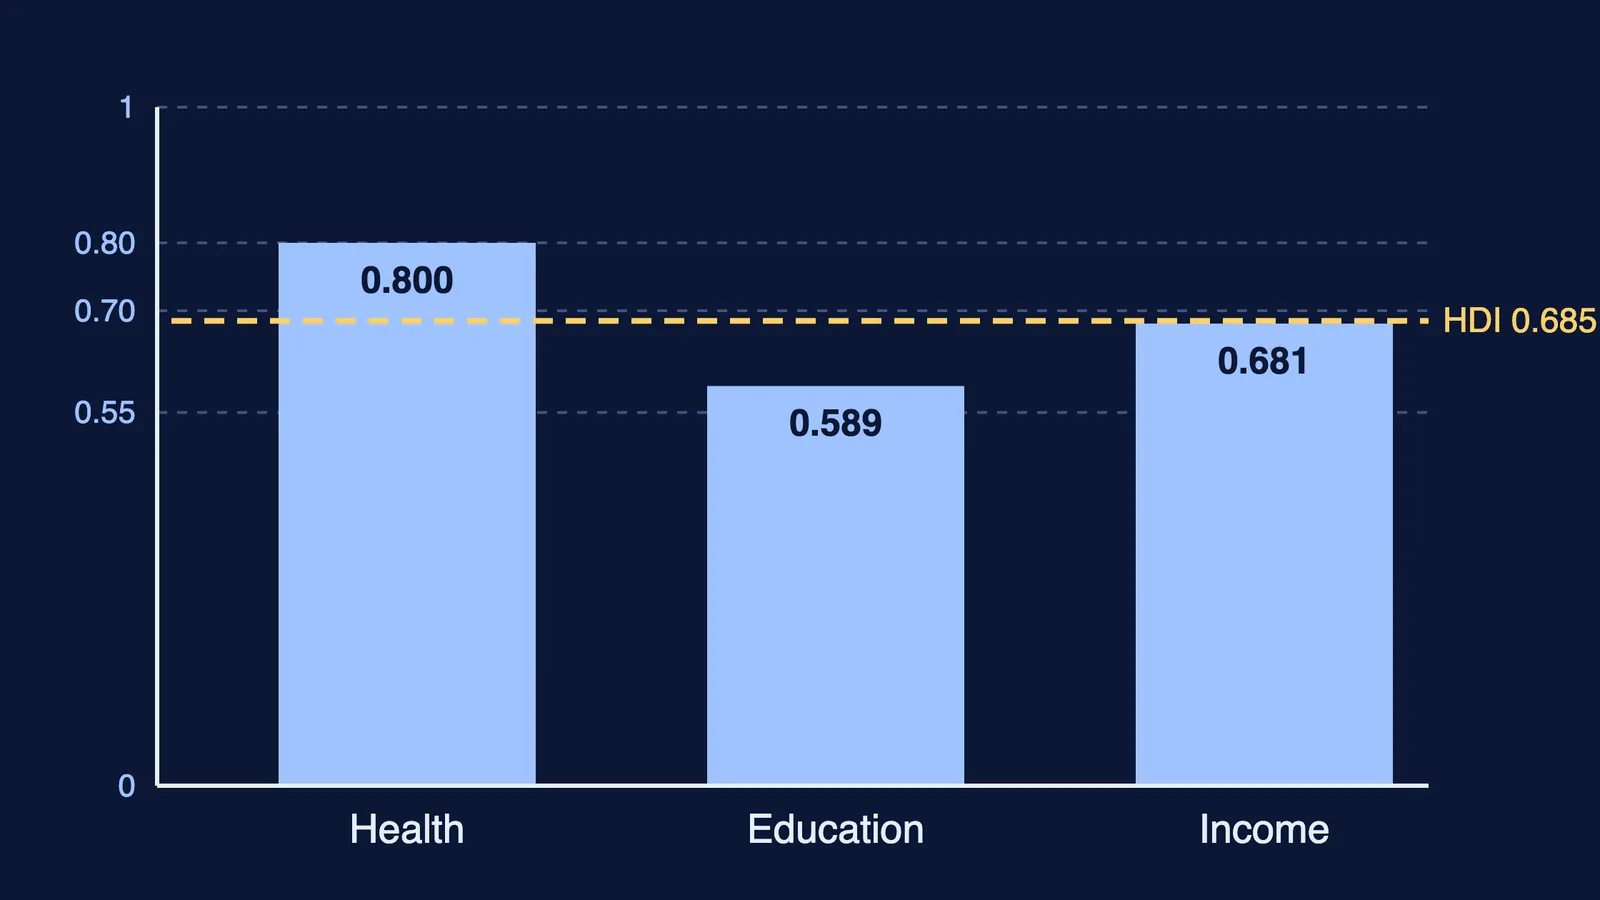
Health index = (72.0 − 20) ÷ (85 − 20) = 0.800
Expected schooling index = 12.95 ÷ 18 = 0.7197
Mean schooling index = 6.88 ÷ 15 = 0.4587
Education index = (0.7197 + 0.4587) ÷ 2 = 0.589
Income index = (ln 9,047 − ln 100) ÷ (ln 75,000 − ln 100) = 4.505 ÷ 6.620 = 0.681
HDI = (0.800 × 0.589 × 0.681)^(1/3) = 0.685
That is the value UNDP publishes, and the same data file ranks India 130th. The technical notes put any HDI from 0.550 to 0.699 in the medium human development group, and 0.700 to 0.799 in high. India's HDI was 0.676 in 2022 and 0.446 in 1990, according to the same file.
UNDP has announced that the 2026 Human Development Report will be released on 1 December 2026, so check for newer figures.
Why does HDI use a geometric mean instead of an average?
A geometric mean punishes imbalance. India's three indices, computed above from UNDP's data file, are close together, so their ordinary average, (0.800 + 0.589 + 0.681) ÷ 3 = 0.690, is only slightly above the geometric mean of 0.685. Now take a made-up country with indices of 0.9, 0.9 and 0.3. Its average is 0.700, but its geometric mean is (0.9 × 0.9 × 0.3)^(1/3) = 0.624. Two strong dimensions cannot hide a weak one.
Inside the education dimension, UNDP deliberately uses the ordinary average instead. The technical notes say this "allows perfect substitutability between expected years of schooling and mean years of schooling."
How can you check your own HDI calculation?
Run through this before you trust a number:
Did you take ln of the income value and of both goalposts, $100 and $75,000, as UNDP's technical notes do?
Did you average the two schooling indices before combining dimensions?
Did you take the cube root of the product, not divide the sum by 3?
Is every index between 0 and 1? If not, a goalpost is wrong.
Does your answer match the published HDI to the third decimal?
If logarithms feel shaky, our guide to why a log base must be positive and not 1 is a quick refresher, and building your own samosa price index shows how any index squeezes many numbers into one. For practice with steps like these, the Fermi Problem Library has worked problems with a step-by-step solver that explains the reasoning rather than printing an answer, and the Fermi Concept Library gives logarithms and means their own lessons.