On this page
Three slips cost marks on a food web diagram: arrows drawn the wrong way, producers floating mid-page, and organisms given one trophic level when they have two. The ideas that fix all three are in your NCERT Class 12 ecosystem chapter.
Which way do the arrows go in a food web?
The arrow points from the food to the eater. Read “grass → grasshopper” as “grass is eaten by the grasshopper”.
The reason is energy. The NCERT Class 12 Biology chapter on ecosystems describes a “unidirectional flow of energy from the sun to producers and then to consumers” (NCERT Biology Class 12, Chapter 12: Ecosystem). The arrows trace that flow, and the chapter draws its own grazing food chain the same way: grass → goat → man.
The common slip is drawing the arrow as “goes after”, from the hungry animal towards its dinner. That reverses the energy flow, and an examiner reads your whole web backwards. Quick test: every arrowhead should touch the mouth that does the eating.
Food webs are harder than they look. In a 1985 study, Alan Griffiths and Bette Grant reported data from 200 high school students that fitted a learning hierarchy for food webs, topped by working out how a change in the size of one population affects another in the same web but not on the same chain. They also reported common misconceptions (Journal of Research in Science Teaching).
Where do producers go when you draw a food web?
At the bottom. Producers such as green plants, phytoplankton and algae belong to the first trophic level, herbivores to the second and carnivores to the third, according to NCERT's Ecosystem chapter, whose Figure 12.2 stacks the levels upward with the arrows pointing up.
With producers at the bottom, your arrows point mostly upward and the energy flow is visible at a glance. The same chapter states the 10 per cent law: only 10 per cent of the energy is transferred to each trophic level from the level below, which is why the number of levels in a grazing food chain is restricted. To practise with those numbers, try our guide to ten per cent law energy flow calculations.
Draw in rows, producers first, and write all the names before adding arrows.
How do you find each organism's trophic level?
Count the arrows. Follow a path from a producer to the organism: its trophic level is the number of arrows plus one. A producer is level 1, anything one arrow away is level 2, and so on.
Do this for every path, not just the first one you see. NCERT says the trophic level “represents a functional level, not a species as such”, and that a species may occupy more than one trophic level in the same ecosystem at the same time. Its example is the sparrow: a primary consumer when it eats seeds, fruits and peas, and a secondary consumer when it eats insects and worms (NCERT Biology Class 12, Chapter 12).
Worked example: a six-organism web
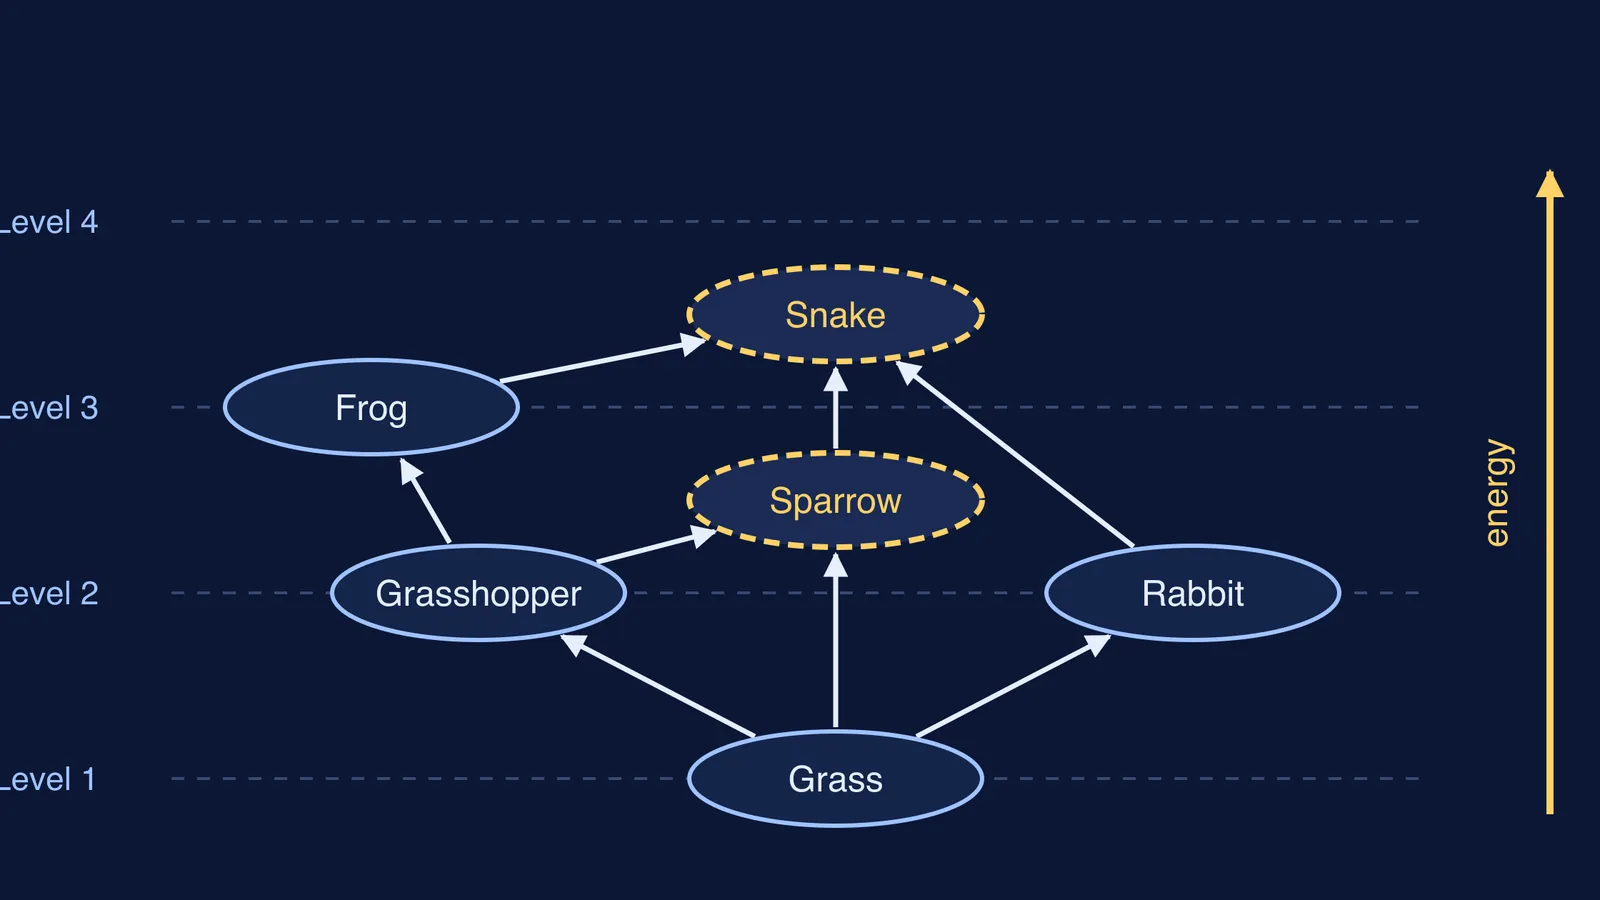
Take grass, grasshopper, rabbit, sparrow, frog and snake, the web in the diagram above. The feeding links are:
Grass → grasshopper, grass → rabbit, grass (seeds) → sparrow
Grasshopper → sparrow, grasshopper → frog
Frog → snake, sparrow → snake, rabbit → snake
Now check each organism:
Grass: producer, level 1.
Grasshopper and rabbit: one arrow from the grass, so level 2.
Frog: grass → grasshopper → frog is two arrows, so level 3.
Sparrow: grass → sparrow is one arrow (level 2); grass → grasshopper → sparrow is two (level 3). The sparrow sits on levels 2 and 3.
Snake: through the rabbit it is level 3; through the frog it is level 4; through the sparrow it is level 3 or 4. The snake sits on levels 3 and 4.
In a long answer, write “sparrow: primary and secondary consumer (levels 2 and 3)”. Omnivores do this all the time; our explainer on trophic levels of omnivores has more cases.
What mistakes cost marks on a food web diagram?
Run this checklist before you move on:
Every arrow points from food to eater and has a clear arrowhead.
Producers are on the bottom row, and no arrow points into a producer from an animal.
Every consumer has at least one arrow coming in.
Organisms that feed at two levels are labelled with both.
If you add decomposers, show arrows from dead matter to them and keep them visibly separate; our guide to detritus versus grazing food chains shows how the two connect.
If trophic levels or energy flow still feel shaky, the Fermi Concept Library has a lesson for every concept in biology, each with its place in the map. For practice, the Fermi Problem Library has worked problems with a step-by-step solver that explains the reasoning rather than printing an answer.
Next time you draw a web, do the arrow test first: point at each arrowhead and ask, “Is this the mouth that eats?”