

On this page
Why does one species sit at more than one trophic level?
In introductory biology, feeding relationships are often taught as simple, linear ladders: a plant produces biomass, an herbivore grazes on it, and a carnivore hunts the herbivore. Real ecosystems, however, operate as interconnected webs where many consumers feed across several categories. According to the NCERT Class 12 Biology textbook, a trophic level represents a functional role in an energy transfer pathway rather than a fixed taxonomic rank assigned to a species.
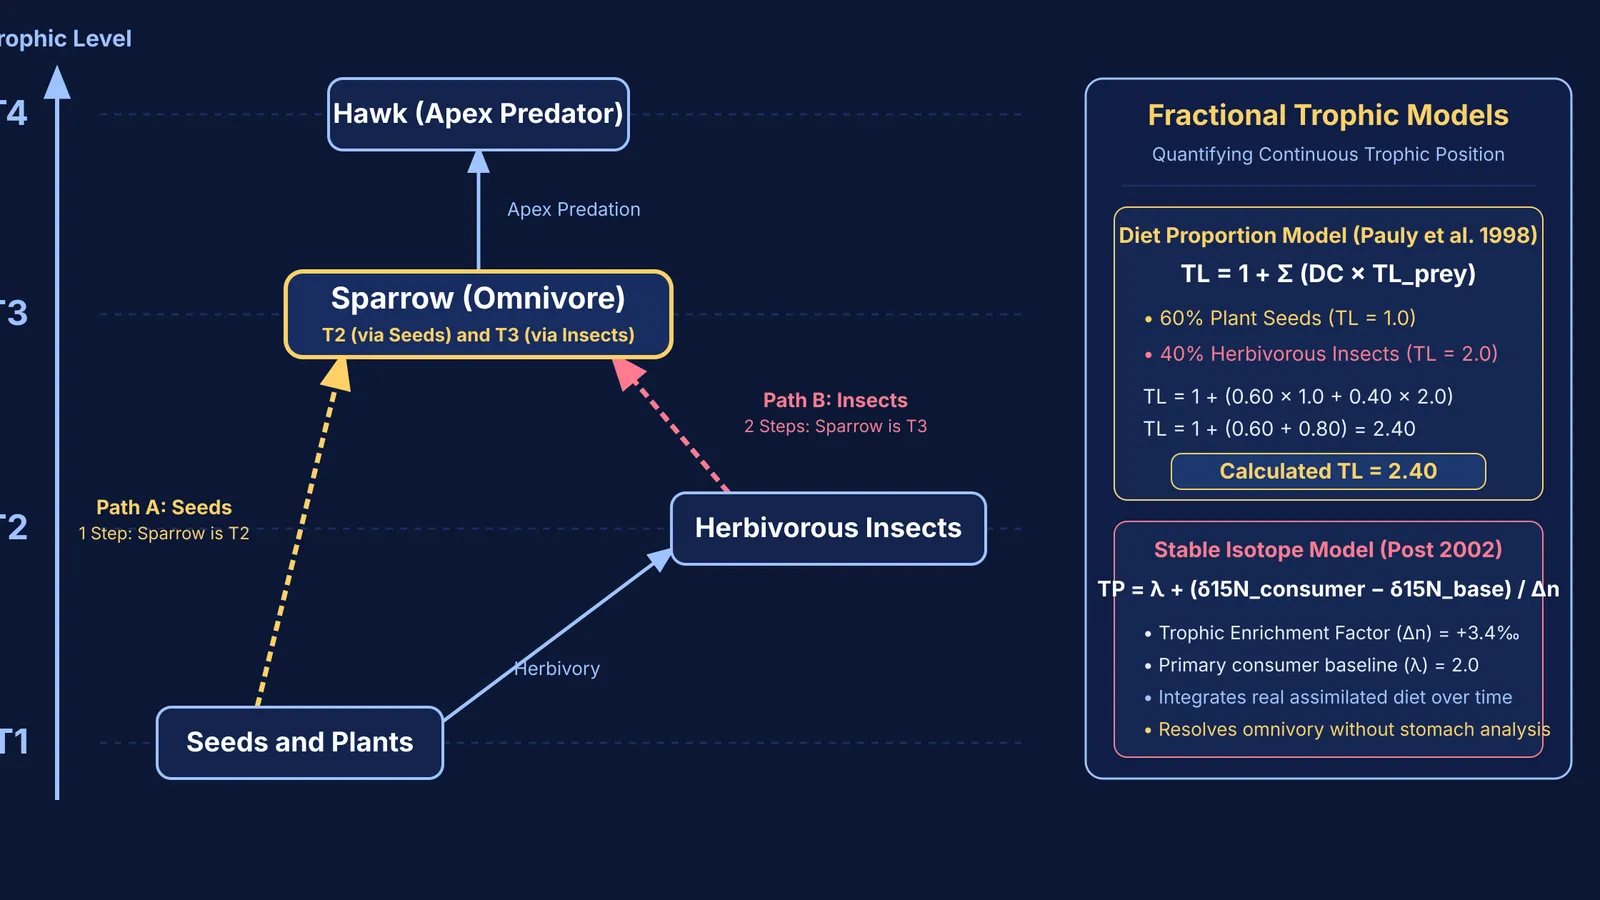
A textbook example is the house sparrow (*Passer domesticus*). When a sparrow eats seeds, fruits, or peas, it acts as a primary consumer, occupying the second trophic level (T2). When the same sparrow feeds on insects or worms, it acts as a secondary consumer, occupying the third trophic level (T3). Humans occupy an even wider range: eating rice or vegetables places you at T2, eating herbivorous poultry places you at T3, and eating predatory fish places you at the fourth trophic level (T4). Because an organism's position shifts with its food source, an omnivore does not have one fixed trophic level.
How do you assign trophic levels in food-web exam questions?
Exam questions in CBSE boards and NEET-UG frequently present a food web diagram and ask for the trophic level of a specific animal. You can review foundational exam patterns in our guide to NEET ecology practice on food chains and pyramids.
To assign trophic levels accurately, use this four-step method:
Identify primary producers: Locate organisms that capture solar energy directly (green plants or phytoplankton). Assign them to trophic level 1 (T1).
Trace each feeding pathway: Follow the arrows upward from the producers to the organism in question, remembering that arrows point from food to feeder.
Count the transfer links: Along a direct plant-to-consumer chain (Plant → Consumer), the organism is at T2. Along a three-step chain (Plant → Herbivore → Consumer), the organism is at T3.
Match the question prompt: If the question names a specific chain, give the single integer for that pathway. If it asks which levels the organism occupies in the web, list every level (such as "both T2 and T3").
Worked example: In a pond web, algae (T1) are eaten by snails (T2) and insect larvae (T2). A carp eats algae directly, but also preys on snails and larvae. Along the chain Algae → Carp, the carp is a primary consumer (T2). Along the chain Algae → Snails → Carp, the carp is a secondary consumer (T3). The carp therefore occupies both T2 and T3 in the same ecosystem.
When solving multi-step food webs, the Fermi Problem Library provides worked problems with a step-by-step solver that explains the reasoning rather than printing an answer.
How do ecologists calculate fractional trophic levels?
While multiple-choice exams use whole integers for individual food chains, field ecologists studying real food webs need a single continuous value to quantify an omnivore's diet. In *Science*, Daniel Pauly and colleagues (1998) formalized the calculation of fractional trophic levels (TL) based on diet proportions.
In this model, primary producers and detritus are assigned a baseline trophic level of 1.0. The trophic level of consumer species i is calculated as:
TL_i = 1 + Σ (DC_ij × TL_j)
Here, DC_ij is the proportion of prey j in the consumer's diet, and TL_j is the trophic level of prey j. Under the framework established by Daniel Pauly and colleagues (1998), if an animal derives 60% of its diet from seeds (TL = 1.0) and 40% from herbivorous grasshoppers (TL = 2.0), its fractional trophic level is 1 + (0.60 × 1.0 + 0.40 × 2.0) = 1 + (0.60 + 0.80) = 2.4.
Because stomach contents only reveal recent feeding, ecologists also measure stable isotope ratios in consumer tissues. As demonstrated by David M. Post (2002) in *Ecology*, nitrogen-15 (δ¹⁵N) enriches in consumer tissues relative to dietary prey. Across ecosystems, δ¹⁵N increases by an average trophic enrichment factor of 3.4‰ per feeding step. Comparing an animal's δ¹⁵N against an herbivorous baseline yields its continuous trophic position directly from tissue chemistry.
To explore how nutrient and energy flows connect primary producers to top predators across biomes, the Fermi Concept Library maps every concept in physics, chemistry, biology, mathematics and computing, each with its own lesson and its place in the map.
Why do classic ecological pyramids exclude omnivores?
Ecological pyramids—first introduced through Charles Elton's pioneering work on ecological pyramids—arrange producers and consumers into stacked horizontal tiers of numbers, biomass, or energy. While useful for showing energy loss, as detailed in Class 10 food chains and ecosystem dynamics, they carry major theoretical limitations.
As highlighted in the NCERT biology syllabus, classic Eltonian pyramids assume a simple, unbranched food chain. Because each horizontal bar can hold only one discrete trophic rank, the pyramid cannot accommodate organisms that feed across two or more levels at the same time. Placing an omnivore like a sparrow or human into a biomass pyramid requires either arbitrarily splitting their population across tiers or leaving them out. Eltonian pyramids also completely exclude decomposers and saprophytes, despite their vital role in nutrient recycling.
Tracing the distinct feeding branches from primary producers gives you the exact trophic level needed for any food-web question.


