
On this page
A ball dropped onto a hard floor packs two ideas into one picture: steady acceleration in the air and a sudden change at every bounce. NCERT's Class 11 chapter on motion in a straight line sets it as Exercise 2.8: a ball dropped from 90 m loses one tenth of its speed at each collision, and you plot its speed-time graph from 0 to 12 s (NCERT Class 11 Physics, Chapter 2). Here are both graphs, drawn with real numbers, and a checklist for exams.
What does the position-time graph of a bouncing ball look like?
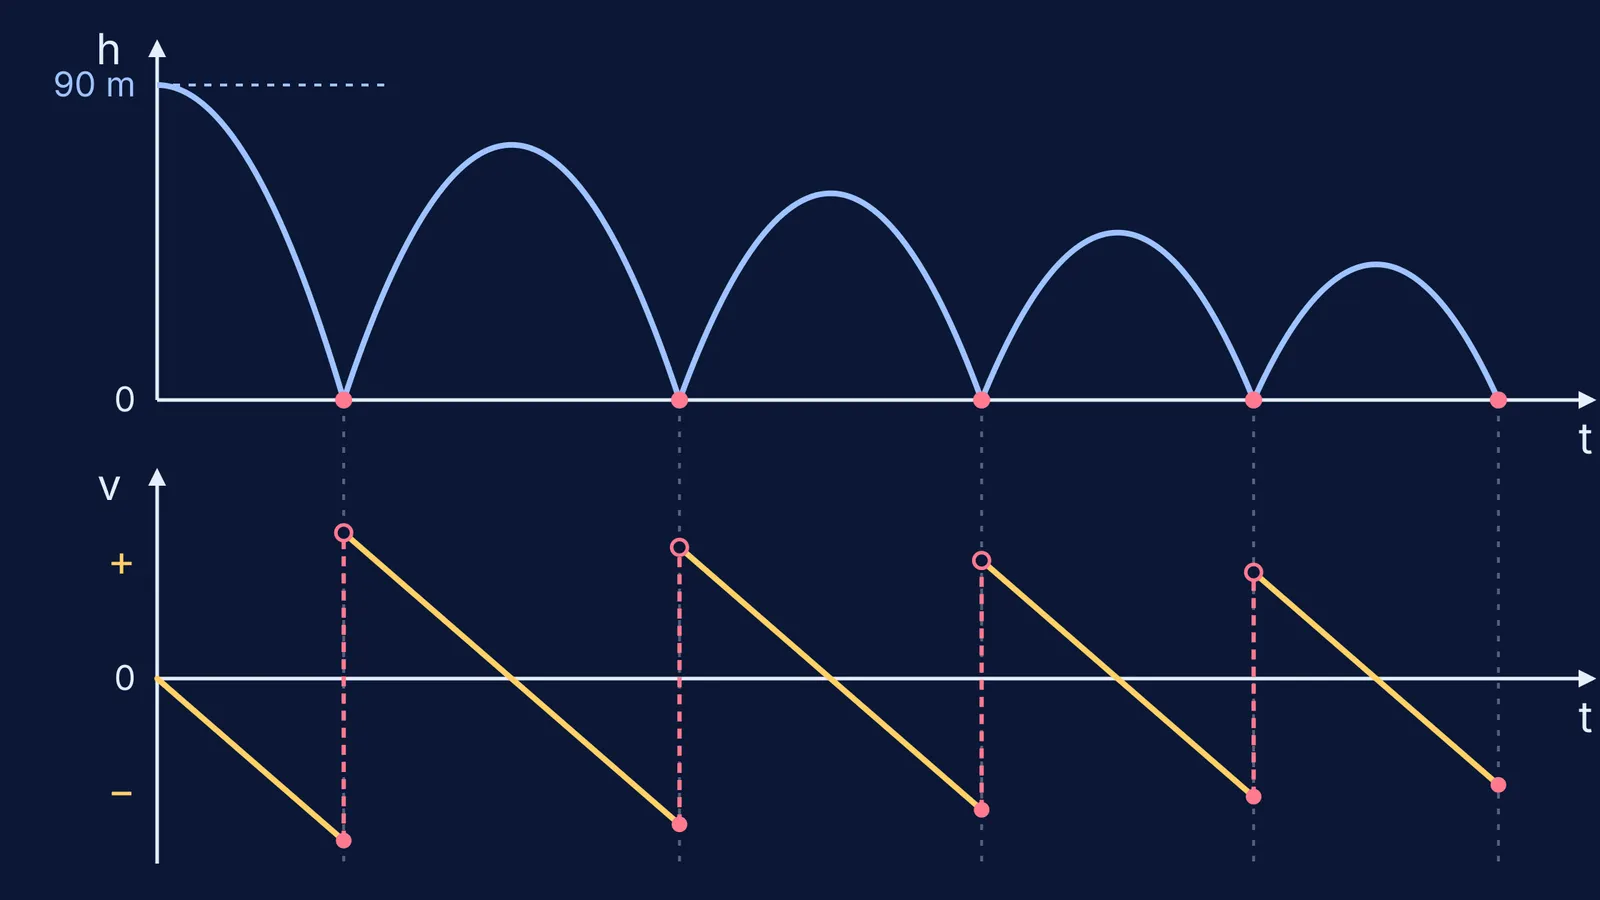
Take upward as positive and the floor as height zero. Between bounces the only acceleration is gravity, which NCERT takes as 9.8 m/s² downward (NCERT Chapter 2). The same chapter states that under uniform acceleration the position-time graph is a parabola, curving downward when the acceleration is negative.
So the height-time graph is a chain of upside-down parabolic arcs, flat at each top and steepest at the floor. At every bounce the slope jumps from steeply negative to steeply positive, making a sharp corner. The arcs get lower and narrower as the ball loses speed.
A common trap is drawing this graph as the ball's path. Robert Beichner, who tested 895 high school and college students, lists misinterpreting graphs as pictures among a consistent set of difficulties with kinematics graphs found in earlier research (Beichner, American Journal of Physics, 1994). The horizontal axis is time; the ball only moves up and down.
What does the velocity-time graph of a bouncing ball look like?
The slope of a velocity-time graph is the acceleration (NCERT Chapter 2). In the air the acceleration is always −9.8 m/s², so every flight is a straight line sloping down at the same angle.
At each bounce the velocity flips from negative (moving down) to positive (moving up), drawn as a vertical jump. The result is a saw-tooth of parallel sloping lines, each shorter than the last. NCERT's Exercise 2.15 shows a graph of this kind, Fig. 2.12(b), and asks for a physical situation that fits it. A bouncing ball does.
Worked example: NCERT's 90 m drop, step by step
Use g = 9.8 m/s² with upward as positive, as in the NCERT chapter.
First fall. From h = ½gt², the ball takes √(2 × 90 ÷ 9.8) ≈ 4.29 s to reach the floor, arriving at √(2 × 9.8 × 90) = 42 m/s. On the v-t graph, draw a line from 0 down to −42 m/s at 4.29 s. On the h-t graph, draw half a parabola from 90 m down to 0, flat at the start.
First bounce, t = 4.29 s. Losing one tenth of its speed, the ball leaves at 0.9 × 42 = 37.8 m/s upward. The v-t graph jumps from −42 to +37.8.
Second flight. Rising takes 37.8 ÷ 9.8 ≈ 3.86 s, up to 37.8² ÷ (2 × 9.8) ≈ 72.9 m. Falling takes the same time, so the next impact comes at about 12.0 s, at 37.8 m/s. On the v-t graph, draw a line from +37.8 to −37.8, crossing zero at about 8.14 s, directly below the top of the second arc.
The pattern. Each bounce multiplies the speed by 0.9 and the height by 0.81, so the next rise would reach about 59.0 m.
NCERT asks for speed, the velocity without its sign: 0 up to 42 m/s, a drop to 37.8 m/s, down to 0 at 8.14 s, back to 37.8 m/s at 12 s. To check the second flight, compare areas: the triangle above the time axis cancels the one below, because the ball rises and falls 72.9 m. Our post on why area below the time axis is negative displacement explains that rule.
How do you check your sketch in an exam?
Lillian McDermott and colleagues described two categories of student difficulty with graphs: connecting graphs to physical concepts, and connecting graphs to the real world (McDermott, Rosenquist and van Zee, American Journal of Physics, 1987). These checks cover both:
Every flight segment on the v-t graph has the same slope, −g.
Each zero on the v-t graph sits directly below the top of an arc. See why acceleration is not zero when a thrown ball reaches the top.
Each bounce on the h-t graph lines up with a jump on the v-t graph.
The jump goes from a negative value to a smaller positive one, unless no speed is lost.
Every arc curves downward, as in how to tell the acceleration sign from a position-time graph.
For more practice, the Fermi Problem Library has worked problems with a step-by-step solver that explains the reasoning rather than printing an answer. If slope versus area is still shaky, the Fermi Concept Library gives each physics concept its own lesson.
Try it now: sketch both graphs for a ball that loses one fifth of its speed per bounce, then run the checklist.