

On this page
A position-time (x-t) graph shows where an object is at any given moment. While finding velocity from this graph is straightforward—you just look at the slope—finding the acceleration requires looking at how the line curves.
Whether a car is speeding up from a red light or a ball is thrown into the air, you can read the sign of its acceleration just by glancing at the shape of its position-time graph. By learning to read these shapes, you can solve kinematics problems without writing out a single equation.
Why does curvature reveal acceleration?
The slope of a position-time graph represents velocity. When you draw a tangent line to the curve at any point, the steepness of that tangent tells you how fast the object is moving. If the graph is a straight line, the slope is constant. That means the velocity is constant and the acceleration is zero.
When the line is curved, the slope is changing from one moment to the next. A changing slope means the velocity is changing, which by definition means the object is accelerating. In mathematical terms, instantaneous acceleration is the second derivative of position with respect to time (a = d²x/dt²).
In calculus, the second derivative tells you the concavity of a graph. If the second derivative is positive, the function is concave up. If it is negative, the function is concave down. This is why the curvature of a position-time graph directly reveals the sign of the acceleration.
The smile and frown rule
You do not need to calculate the exact slope at multiple points to find the sign of acceleration during an exam. You only need to look at the concavity of the curve. The Physics Classroom suggests thinking of the graph as a physical shape.
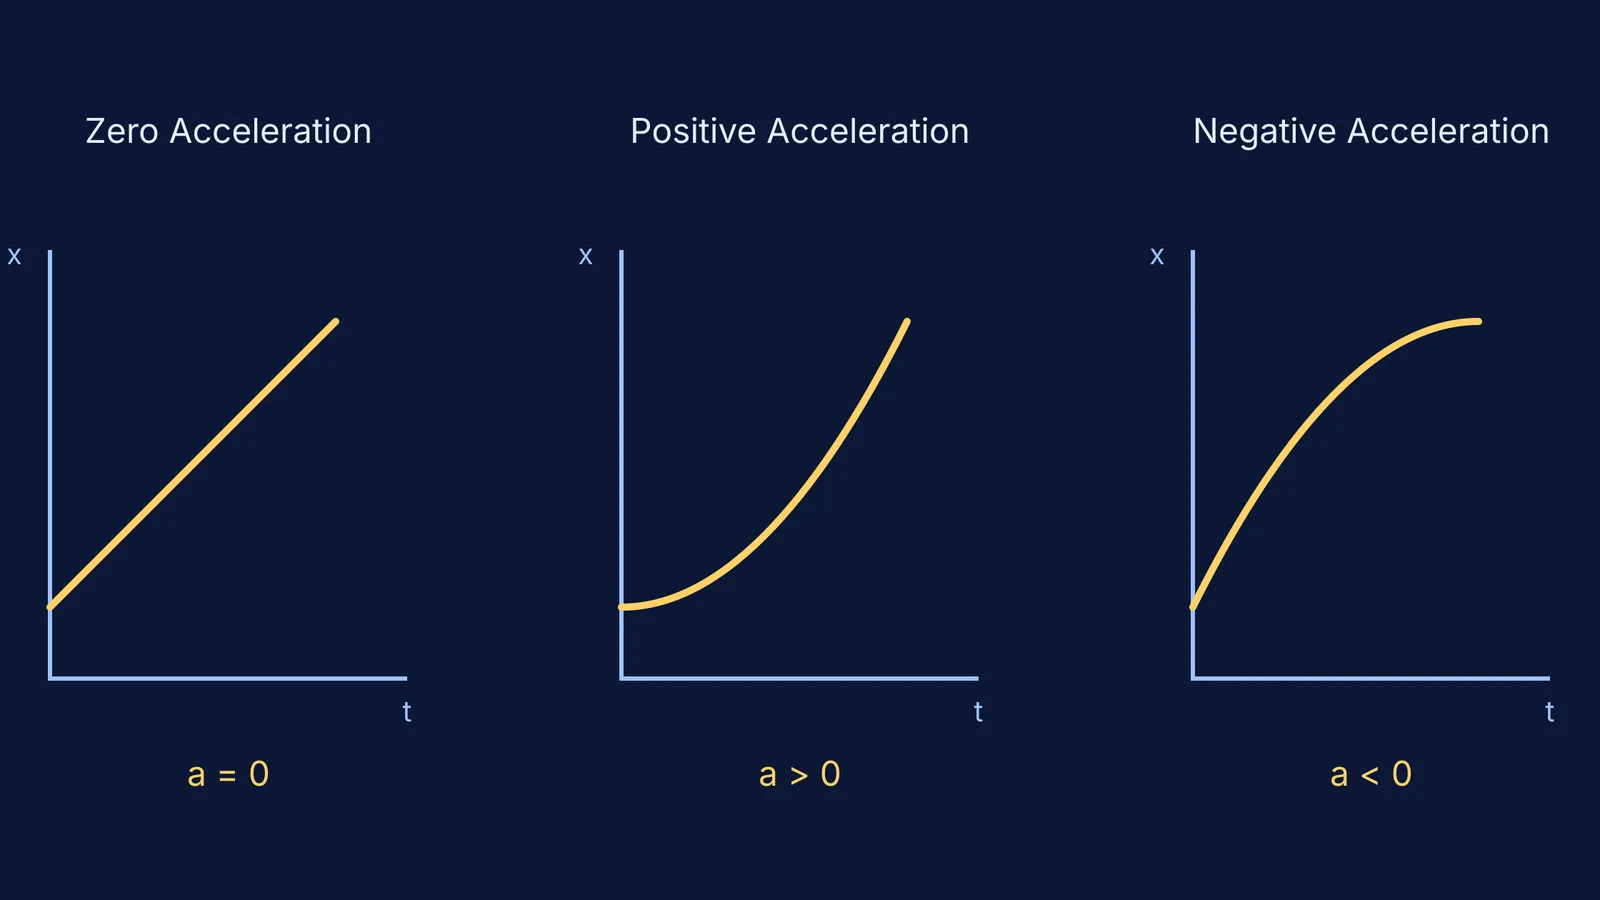
Zero acceleration: The graph is a straight line. The velocity is constant because the slope never changes.
Positive acceleration (a > 0): The graph is concave up. It curves upward like a smile or a cup. This shape means the slope is becoming more positive (or less negative) over time. For example, a car starting from rest and moving forward will create a curve that starts flat and gets steeper upwards.
Negative acceleration (a < 0): The graph is concave down. It curves downward like a frown or an upside-down cup. This shape means the slope is becoming more negative (or less positive) over time. If you throw a ball straight up, its position graph forms a parabola that opens downward, showing constant negative acceleration due to gravity.
Does negative acceleration mean slowing down?
A common mistake in physics is assuming that negative acceleration always means an object is slowing down. The sign of acceleration only tells you which way the velocity is changing, not whether the object is getting faster or slower.
To know if an object is speeding up or slowing down, you must compare the sign of the acceleration (the curvature) with the sign of the velocity (the slope):
Speeding up: Velocity and acceleration have the same sign. The slope is moving away from the horizontal axis, getting steeper. This happens when a car drives forward and presses the gas pedal (both positive), or when it drives in reverse and speeds up backwards (both negative).
Slowing down: Velocity and acceleration have opposite signs. The slope is moving toward the horizontal axis, getting flatter. This happens when a forward-moving car hits the brakes (positive velocity, negative acceleration).
If an object is moving in the negative direction (which means it has a negative velocity) and it experiences a negative acceleration, it is actually speeding up in the reverse direction. The negative signs work together to increase the object's speed.
If you find yourself stuck translating between motion and graphs, the Fermi Concept Library holds every concept in physics, chemistry, biology, mathematics and computing, each with its own lesson and its place in the map.
A framework for exam questions
When you encounter an x-t graph in a test, follow these steps to decode the entire motion story:
Look at the slope: Is it going up (positive velocity) or down (negative velocity)?
Look at the steepness: Is it getting steeper (speeding up) or flatter (slowing down)?
Look at the curve: Is it concave up (positive acceleration) or concave down (negative acceleration)?
These rules hold true for any motion problem you might face. If you are dealing with acceleration given as a function of v or x, the physical meaning of the signs remains the same. Similarly, when you calculate distance in the nth second, the underlying formulas rely on these constant-acceleration principles and their graph shapes.


