
On this page
When a birdwatcher in Pune logs a sighting in eBird, that record can end up in a global database that scientists use to map where species live. The people who design those databases, clean the records and run the projects that collect them work in a field called biodiversity informatics. It sits between biology and data science, and a school student can try parts of the real work before choosing a degree.
What is biodiversity informatics?
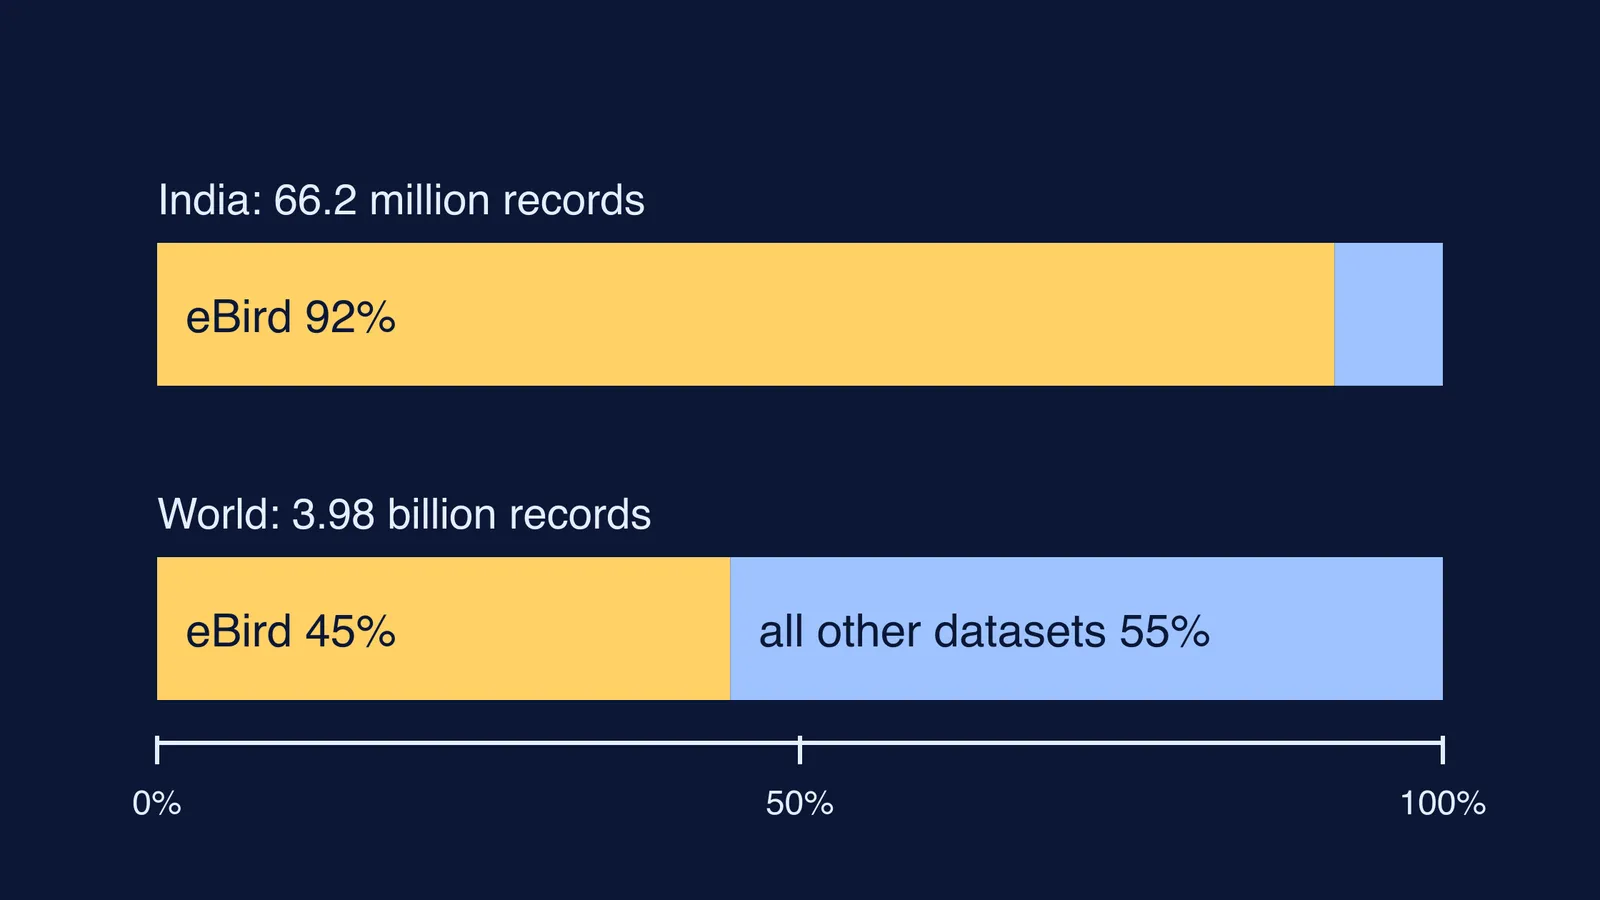
Biodiversity informatics is the work of collecting, standardising, sharing and analysing records of where and when living things were found. The largest open store of these records is the Global Biodiversity Information Facility (GBIF). On 27 October 2026, the GBIF occurrence API reported about 3.98 billion occurrence records worldwide, and 66,187,876 records for India.
Records from museums, surveys and apps can only be combined because they share a vocabulary. Darwin Core is a standard glossary of terms "intended to facilitate the sharing of information about biological diversity." Its term list includes scientificName, eventDate, decimalLatitude, decimalLongitude, coordinateUncertaintyInMeters and basisOfRecord, where a value such as HumanObservation separates a sighting from a PreservedSpecimen in a museum drawer.
How much of the data comes from citizen scientists?
A lot, and in India most of it. We queried the GBIF API for this post: of India's 66.2 million records, 60,613,324 come from the eBird Observation Dataset, the citizen science birding dataset built from volunteers' checklists. That is about 92%. Worldwide, eBird supplies 1,775,781,186 records, about 45% of the total.
Research describes the same wider pattern. A paper in the Journal of Applied Ecology (Groom and colleagues, 2017) states that citizen scientists generate the vast majority of terrestrial biodiversity observations. A 2017 study in Biological Conservation found that most of the citizen science schemes it compiled were in Europe, North America, South Africa, India and Australia.
Indian projects show the scale. During the Great Backyard Bird Count 2026, held 13-16 February, around 7,336 eBirders in India uploaded 64,992 checklists and recorded 1,093 species across 562 districts, and 570 campuses joined the Campus Bird Count run alongside it. SeasonWatch asks people to watch the flowering, fruiting and leaf-flush of 130+ common trees every week; its site lists 1,037,540 observations and 3,950 schools.
What does the job involve day to day?
Roles go by different names: data manager, biodiversity data analyst, citizen science coordinator, GIS analyst. The work usually falls into four parts:
Designing the collection. Deciding what volunteers record, writing the protocol and building forms a beginner can fill in correctly.
Cleaning records. Checking that a tree is not plotted in the sea, that a date is not in the future, and that a misspelt name matches an accepted species.
Publishing. Mapping columns to Darwin Core terms and sharing the dataset openly with a clear licence.
Analysing and reporting. Turning checklists into range maps or trend graphs, and telling volunteers what their data showed.
The Journal of Applied Ecology paper also found that datasets from volunteers were among the most restrictive about reuse, and said organisations that manage these data should make their data-sharing policies open and explicit. So part of the job is people and policy, not just code.
Which biology and data skills do you need?
From biology: identifying at least one group well (birds, trees, butterflies), taxonomy and scientific names, and school ecology, especially populations and sampling. From data: spreadsheets first, then Python or R, basic statistics (averages, bias, uncertainty), maps and coordinates, and clear writing for non-experts.
If ecology terms or statistics feel shaky, the Fermi Concept Library has a lesson for every concept in biology and mathematics, each with its place in the map.
How can you test this career in four weeks?
Week 1: join one project. Submit ten bird checklists, or pick five trees near home to watch for SeasonWatch.
Week 2: download your own records as a spreadsheet and find the Darwin Core-style columns: species, date, latitude, longitude.
Week 3: clean them. Fix a misspelt name, flag a location you are unsure of, and count species per week.
Week 4: make one chart and write five sentences on what it shows and what it cannot show.
If you enjoyed week 3 more than week 1, data roles may suit you; if week 1 was the highlight, look at field roles. If you are not sure where to begin on the statistics, Fermi's AI tutor works out what you already know and builds a plan for the session.
For degree routes, read what comes after a zoology degree, the data analyst skills students can build early and how science graduates join the forest service.