On this page
Companies generate massive amounts of information every day. A data analyst turns this raw data into clear answers that a business can use to make decisions. They act as detectives, asking the right questions to find patterns that matter.
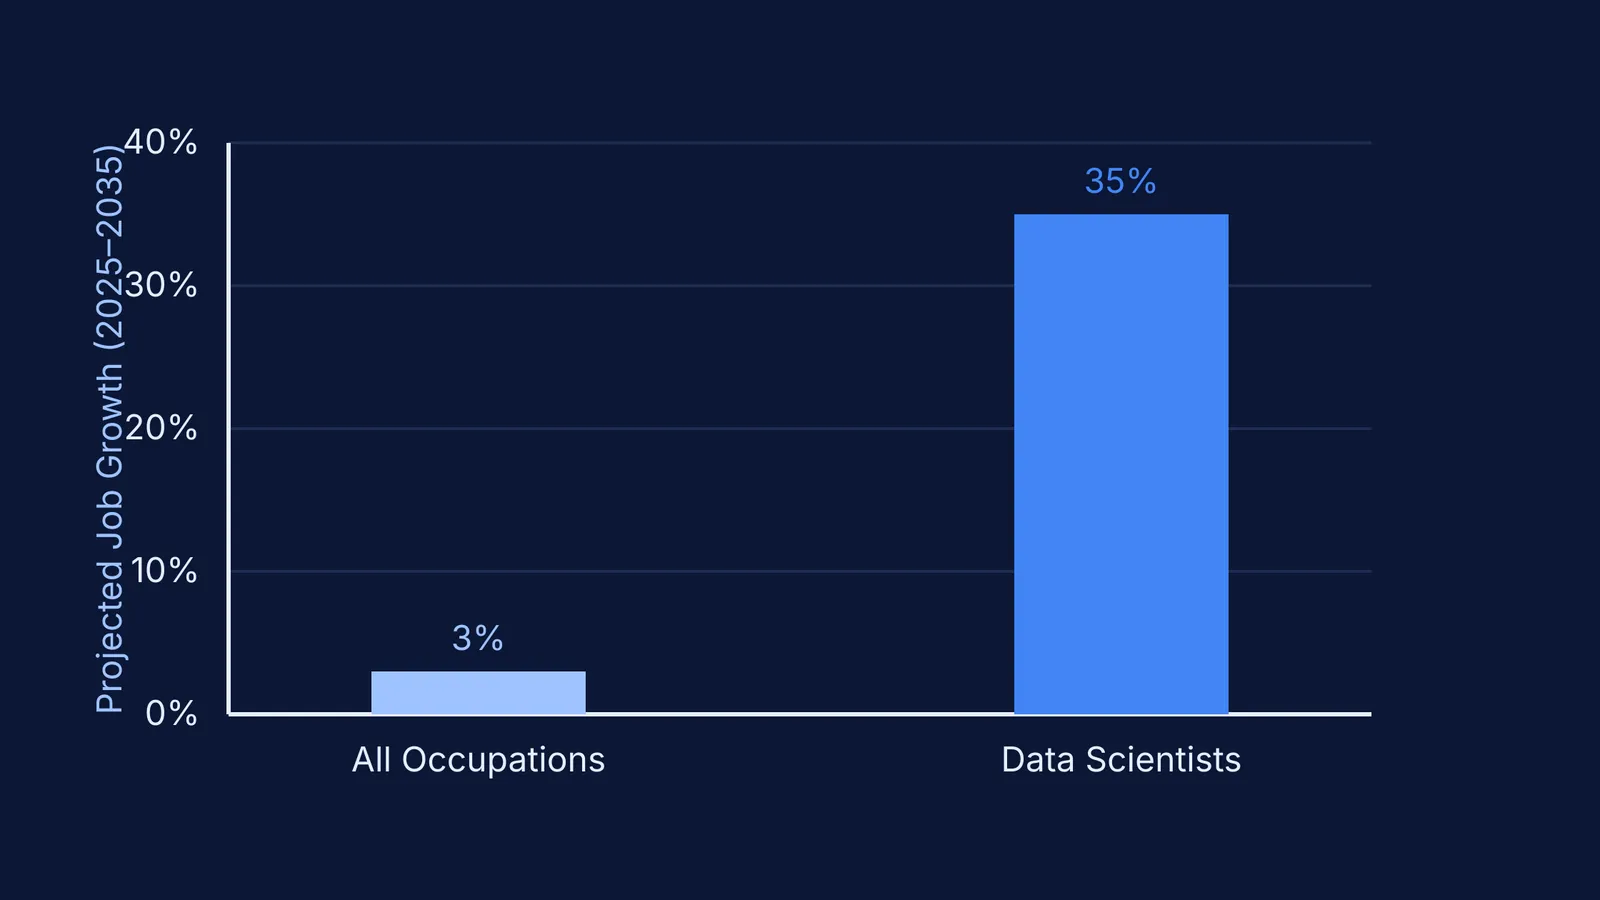
The demand for these skills is high. Employment in data science is projected by the U.S. Bureau of Labor Statistics to grow by 35% from 2025 to 2035, creating 24,800 openings each year. This makes it a compelling path for students.
You do not have to master every programming language at once. Instead, focus on a core set of tools to prepare data, query it, and communicate findings.
What skills do you need to become a data analyst?
A 2026 study in the International Journal for Research in Applied Science and Engineering Technology maps out how standard tools divide the work across a typical project.
According to the research, an analyst often uses Microsoft Excel for the initial look and quick preprocessing. They rely on SQL for efficient database management and structured querying when data is large. Python steps in for data cleaning and transformation, while Power BI turns the final numbers into interactive dashboards.
Build your skills one by one, starting with the most visual and immediate tools.
Do you need to learn coding to be a data analyst?
You do need to learn some code, but not like a software engineer. You are writing instructions to filter and calculate information.
Your first step should be SQL, the language for relational databases. When a company has millions of records, Excel crashes, but SQL filters them in seconds. Learn commands like SELECT, JOIN, and GROUP BY to extract what you need.
Once comfortable with SQL, move on to Python. Python is valued for data manipulation libraries like Pandas, allowing you to automate repetitive cleaning. However, entry-level roles focus heavily on SQL and Excel.
To understand the foundational logic before typing code, the Fermi Concept Library contains a lesson for every concept in computing and mathematics, mapping out how ideas like loops and database joins fit together.
How much maths and statistics do you need?
You need a solid, practical grip on descriptive statistics. A data analyst must be able to summarise a dataset accurately and spot when something looks wrong.
Be comfortable with measures of central tendency (mean, median, mode) and spread (variance, standard deviation). Know how to identify outliers, similar to techniques in John Tukey and the box plot: how to look at data before testing it. Understand how adding to or scaling data changes the mean and variance when cleaning datasets.
If you hit a wall, Fermi's AI tutor can help. It works out what you already know and builds a plan for the session, teaching the reasoning behind the mathematics. It draws graphs and walks you through steps until the idea clicks.
How do you build a data analyst portfolio?
Employers want to see you handle messy data. A project portfolio often matters more than certificates. Show the journey from raw data to clear insight.
Here is a practical, five-step framework to build your first portfolio project:
Find a dataset: Look for a free dataset on Kaggle or the World Bank.
Clean the data: Open it in Excel. Find blank cells, remove duplicate rows, and fix formatting errors.
Query for answers: Load the cleaned data into a free SQL database. Write queries that answer specific questions.
Visualise the findings: Turn the results into charts. Choose the right chart—read about William Playfair and the bar chart: drawing numbers for the eye to see why simple visuals work best.
Publish and explain: Upload your code and charts to GitHub. Write a short summary explaining what the data told you and what it means for a business.
By following this sequence, you prove you have the technical and communication skills for the job. Start with a spreadsheet, learn to write a query, and build from there.