On this page
Many graph questions children practise in school are of one kind: “How many in March?” That is the easiest kind. The useful kinds ask what changed, by how much, and why. You can build those habits at the dinner table in a few minutes a week, with a newspaper and your own household numbers.
Why do children find graphs hard to read?
In a 1987 study in the Journal for Research in Mathematics Education, Frances Curcio gave a graph test to 204 fourth graders and 185 seventh graders. For the fourth graders, graph comprehension was predicted not only by reading and maths achievement but also by what they already knew about the topic, the maths involved and the type of graph. Her conclusion was that children should do graphing activities themselves to build that background.
Curcio's research is often summarised as three levels of graph reading, as Carlos Monteiro and Janet Ainley set out in a 2003 paper for the British Society for Research into Learning Mathematics:
Reading the data: lifting information that is right there on the graph.
Reading between the data: interpolating and finding relationships in the data shown.
Reading beyond the data: predicting or inferring something the graph does not show directly.
What should my child look at first on a graph?
Before anyone looks at the bars or lines, read the frame. Ask your child to point and answer out loud:
Title: “What is this graph about? Say it in your own words.”
Axes: “What is measured going up? What runs along the bottom? What are the units?”
Scale: “What does one step on the axis stand for? Does the axis start at zero?”
Source and date: “Who made this, and when?” Newspaper charts print this in small type at the bottom.
How do I use newspaper charts and family data?
Newspapers are a good source because their graphs are about real things and are sometimes wrong. Monteiro and Ainley describe how the researcher Jane Watson suggested that unusual and misleading graphs in print media might be excellent examples to motivate and challenge students. In one survey item for Grade 6 and 9 students in Tasmania, a media pie chart of grocery market shares added up to 128.5%, and a top-tier answer said the percentages should equal 100 (BSRLM, 2003). Pick one chart from the Sunday paper each week; our guide on whether a Class 6 child should read the newspaper has ideas for making the habit stick.
Family data matters because your child already knows the topic, which is exactly the prior knowledge Curcio found helps younger readers. Electricity units from past bills, cricket scores or height marks on the door frame all work.
Worked example: six months of electricity units
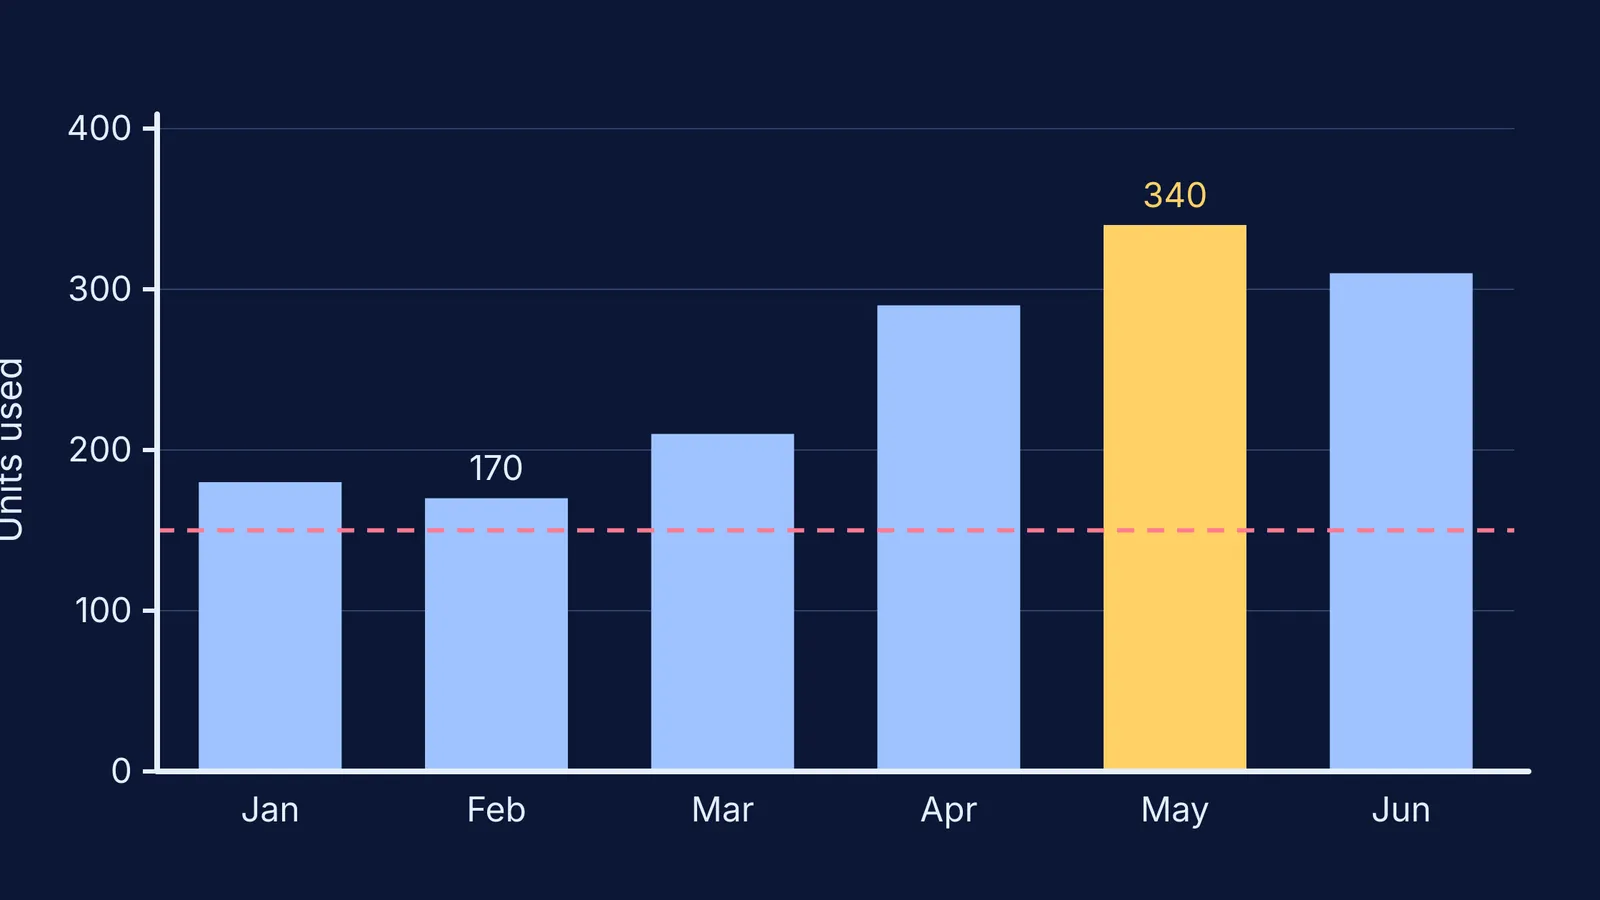
Say your bills show these units used: January 180, February 170, March 210, April 290, May 340, June 310. Draw the bar chart together, with the units axis starting at zero.
Read the data: “Which month used the most?” May, with 340 units.
Read between the data: “How does May compare with February?” Exactly twice as much, 340 against 170. The biggest jump was March to April, 80 units.
Read beyond the data: “Why did April jump? What might July look like when the monsoon cools things down?”
Now redraw the same numbers with the axis starting at 150. The May bar is 190 units tall and February's is 20, so May looks nine and a half times bigger, though it is only double. Our 7-point checklist for spotting a misleading graph goes further.
What three questions turn any graph into a conversation?
In September 2017, the New York Times Learning Network and the American Statistical Association launched a classroom feature called What's Going On in This Graph?, which asks students “What do you notice?” and “What do you wonder?” (International Statistical Institute). Those prompts map loosely onto Curcio's levels. Use these three, in this order:
What do you notice? Any true statement read straight off the graph counts.
What changed most, and by how much? Push for a number: “twice as much”, “80 more”.
What do you wonder? Why did it happen, and what would you expect next?
If your child says something wrong, ask “Where on the graph do you see that?” rather than correcting them. Pointing back to the axis or scale often lets them correct it themselves. If a conversation stalls on the maths underneath, such as what a percentage or an average really means, the Fermi Concept Library has a lesson for each concept in mathematics, so you can look it up together.
Once graphs feel ordinary, maths starts showing up everywhere; our ideas for showing your teenager that maths is used in real life are a natural next step.