On this page
You need one 30 cm ruler, two people and a notebook. It takes one evening and uses Class 9 motion, averages and graphs.
How does the ruler drop reaction time experiment work?
One person, the dropper, holds a 30 cm ruler upright by its top end. The catcher holds a thumb and forefinger open around the zero mark without touching it. The dropper lets go without warning and the catcher pinches it as fast as possible. You read the centimetre mark closest to the pinch. The National Physical Laboratory's home version has the catcher's thumb and forefinger about 1 cm apart, the dropper count silently to a random number between 3 and 5, and failed catches ignored.
Rules that keep the data fair:
Same chair, same height, same arm position every time.
The catcher watches the ruler, not the dropper's face.
Write every catch down; mark a miss as "miss" and leave it out of the average.
How do you turn the catch distance into a reaction time?
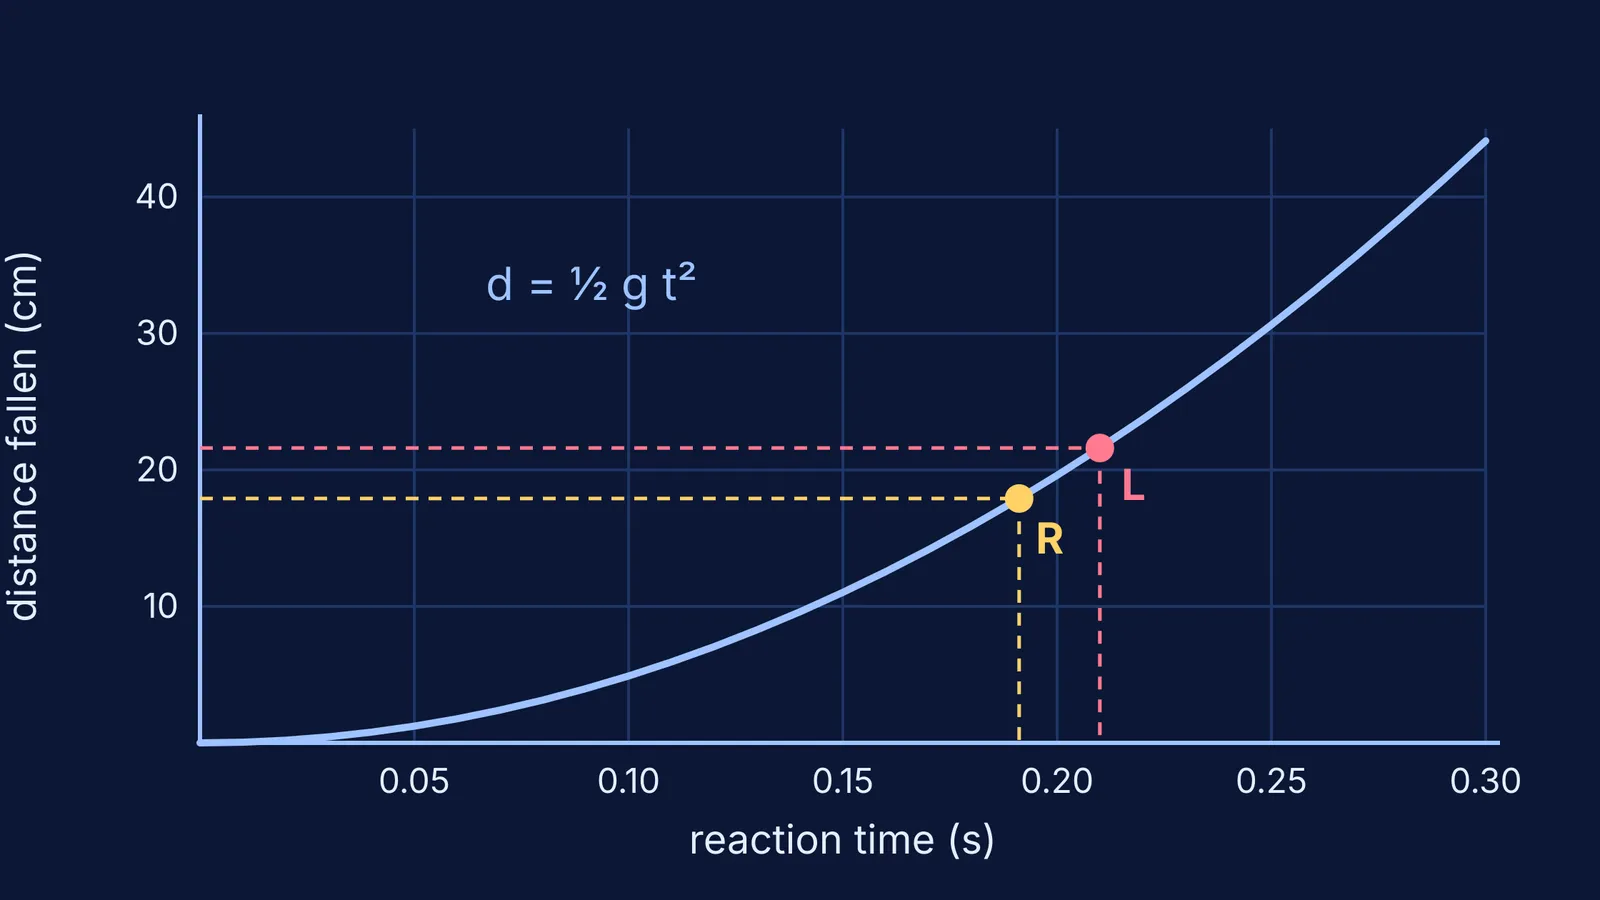
The ruler is in free fall, so the distance it drops is d = ½gt², which rearranges to t = √(2d/g), as the University of North Texas physics demonstration notes set out. With g = 9.8 m/s² and d in centimetres, this becomes t = √(d ÷ 490) seconds. We worked out these values from that formula:
5 cm: 0.101 s
10 cm: 0.143 s
15 cm: 0.175 s
20 cm: 0.202 s
25 cm: 0.226 s
30 cm: 0.247 s
Notice that doubling the distance does not double the time. NRICH's "How do you react?" problem shows this: a catch at 30 cm means a reaction time about 1.41 times (the square root of 2) that of a catch at 15 cm, not twice, because distance grows with the square of time. NRICH treats 0.2 seconds as a typical reaction time, which is a catch at 19.6 cm.
If the curve feels abstract, the Fermi Simulation Lab has interactive simulations for ideas that are easier to see than to read. Our guide to free fall on Earth, the Moon and Jupiter shows how the same drop changes under different gravity.
Why repeat the trials and take an average?
One catch is noisy, so researchers repeat. In a 2014 study in the Journal of Athletic Training, 43 young adults did 10 ruler-drop trials per session in 10 sessions over 5 weeks. In each session the researchers set aside the 3 fastest and 3 slowest times and averaged the middle 4. Average reaction time fell from 264.9 ms in session 1 to 252.0 ms in session 10, with the biggest drop, almost 7 ms, between the first two sessions, so the authors advised at least 1 practice session before recording a baseline.
At home: one uncounted practice round, then 10 recorded catches per hand.
Is your left hand slower than your right?
The NPL activity itself asks you to repeat the catches with the non-dominant hand. Write a prediction first, such as "My writing hand will catch the ruler sooner", then test it.
Here is a worked example with made-up numbers for a right-handed 12-year-old, 10 catches per hand after one practice round:
Right hand (cm): 18.5, 20.0, 17.0, 19.5, 16.5, 18.0, 17.5, 19.0, 16.0, 17.0
Left hand (cm): 22.0, 20.5, 23.5, 21.0, 19.5, 22.5, 21.5, 20.0, 24.0, 21.5
Average: right 179 ÷ 10 = 17.9 cm; left 216 ÷ 10 = 21.6 cm.
Convert: right √(17.9 ÷ 490) = 0.191 s; left √(21.6 ÷ 490) = 0.210 s.
Difference: about 0.019 s, or 19 milliseconds.
Check the spread: right 16.0 to 20.0 cm, left 19.5 to 24.0 cm. The ranges overlap only between 19.5 and 20.0 cm, which suggests a real gap, but repeating the test on another day is the better check.
Researchers use a sturdier version: a 2010 study of 94 Division I college football players used a 1.3 m measuring stick set in a weighted rubber disk and measured a mean of 203 milliseconds.
How do you graph the reaction time results?
A 30-minute plan for the evening:
In the notebook, list trial number and distance for each hand, then convert each distance to seconds.
Plot trial number (1 to 10) on the x-axis and reaction time in seconds on the y-axis, one colour per hand, dots joined.
Draw a horizontal line at each hand's average.
Look for three things: which line sits lower (faster), whether either line slopes down (practice), and how far the dots scatter around their average.
Write a two-sentence conclusion and one thing to test next, such as morning against night.
Our guide to drawing error bars and finding uncertainty on a graph shows how to show that scatter, and estimation games for kids has more guess-then-measure ideas for the same notebook.
If your teen wants to go from here to the equations of motion, the Fermi Concept Library has a lesson for every concept in physics, chemistry, biology, mathematics and computing.
Start tonight: one ruler, one practice round, ten catches a hand.