

On this page
A straight-line graph in a physics practical gives you a gradient. Error bars tell you how far to trust it. Here is the method, then a worked voltage-current example from the Ohm's law experiment.
That experiment is on the CBSE syllabus: the CBSE Class 12 physics curriculum for 2025-26 lists determining the resistivity of wires "by plotting a graph for potential difference versus current" as its first Section A experiment. The graphing method follows the AQA AS and A-level Physics required practical handbook, a UK exam board's guide, so check what your own teacher expects.
What do error bars on a graph show?
An error bar is a line through a plotted point showing the range the true value probably lies in. Short bars mean consistent repeats; long bars mean scattered ones.
The AQA handbook accepts a simple method: plot the point at the mean value, find the range of the repeat readings (ignoring anomalies), and draw bars of half the range on either side.
How do you draw error bars on a physics graph?
Take at least three readings of the y-axis quantity at each setting.
Plot the mean as a small cross.
Work out half the range of the repeats: that is the bar length above and below the cross.
Rule the bar vertically, with a short cap at each end.
If the x-axis quantity also varied, add a horizontal bar the same way.
The AQA handbook also asks that plotted points cover at least half the grid in exams, so choose a scale where the bars are big enough to see.
How do you draw best-fit and worst-fit lines?
The best-fit line is a thin pencil line with roughly as many points above it as below, and the handbook says it should fall within the error bars. It need not pass through the origin.
The worst-fit line is the steepest or the shallowest straight line that still passes through every error bar. Join the bottom of the first bar to the top of the last for the steepest, and the top of the first to the bottom of the last for the shallowest. Then check that each line crosses every bar in between.
The AQA handbook gives: percentage uncertainty in gradient = |best gradient - worst gradient| / best gradient x 100%.
Worked example: uncertainty in resistance from a V-I graph
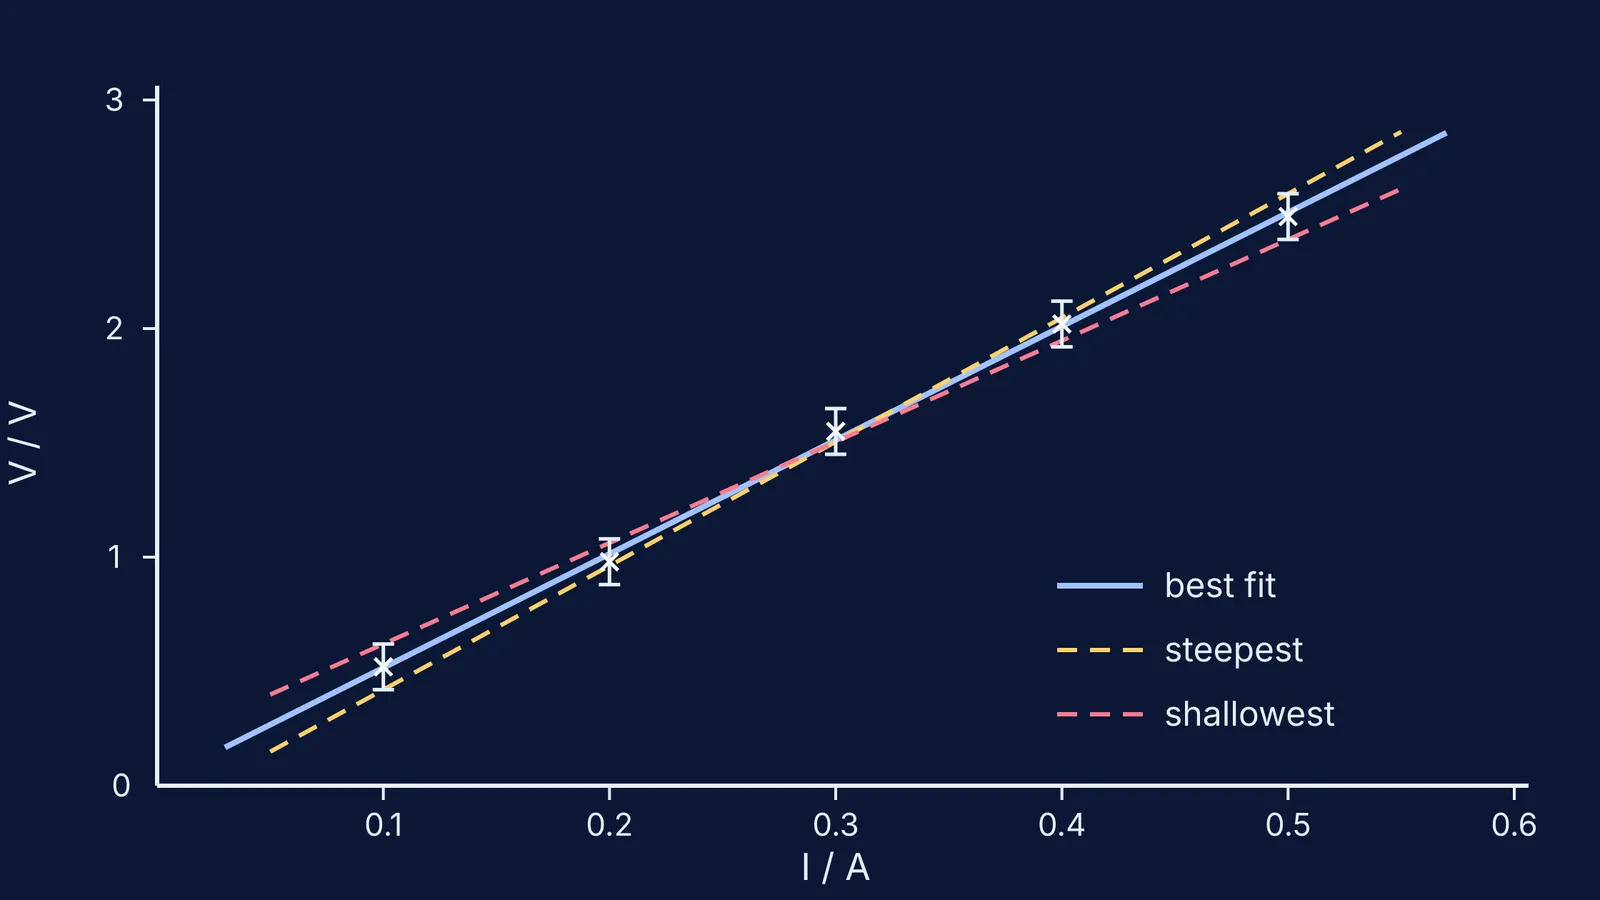
Here is an illustrative data set for a wire, with voltage read three times at each current. At 0.30 A the repeats were 1.45 V, 1.56 V and 1.64 V: mean 1.55 V, range 0.19 V, so half the range is about 0.10 V. Suppose the other settings spread similarly, so every point gets a bar of ± 0.10 V.
I = 0.10 A, mean V = 0.52 V
I = 0.20 A, mean V = 0.98 V
I = 0.30 A, mean V = 1.55 V
I = 0.40 A, mean V = 2.02 V
I = 0.50 A, mean V = 2.49 V
Plot V on the y-axis and I on the x-axis, so the gradient is the resistance R.
Best line. Draw it through the middle of the points. Reading two points on the line, (0.05 A, 0.27 V) and (0.55 A, 2.76 V), gives a gradient of 2.49 / 0.50 = 4.98 ohms.
Steepest line. Join (0.10 A, 0.42 V) to (0.50 A, 2.59 V). Gradient = 2.17 / 0.40 = 5.43 ohms. Check: at 0.20 A it reads 0.96 V, inside the bar from 0.88 to 1.08 V.
Shallowest line. Join (0.10 A, 0.62 V) to (0.50 A, 2.39 V). Gradient = 1.77 / 0.40 = 4.43 ohms. Check: at 0.40 A it reads 1.95 V, inside the bar from 1.92 to 2.12 V.
Uncertainty. The steepest line differs from the best by 0.45 ohms and the shallowest by 0.55 ohms. Using the AQA formula with the larger, cautious difference: 0.55 / 4.98 x 100% = 11%.
Result. R = (5.0 ± 0.6) ohms, quoting the uncertainty to one significant figure and the value to match.
To turn R into resistivity, combine this 11% with the uncertainties in length and diameter, as in our guide to combining absolute and percentage errors. The full experiment is in resistivity of a wire from a V-I graph.
What mistakes cost marks on practical graphs?
Bars of the full range instead of half the range on each side.
A worst line that misses one bar, usually a middle one.
Gradient read from data points rather than from the line.
A line forced through (0, 0). The AQA handbook notes that a line expected to pass through the origin but which misses it suggests a systematic error, worth discussing rather than hiding.
An uncertainty quoted to more significant figures than it can support.
If graphs click faster when you can see them move, the Fermi Simulation Lab has interactive simulations for ideas that are easier to see than to read. Revising for JEE Main? See experimental skills in the JEE Main physics syllabus.


