

On this page
Stretch a balloon over a bottle of warm water, sugar and yeast, and it slowly swells. The gas is carbon dioxide. Yeast breaks glucose down into ethanol and carbon dioxide (C6H12O6 → 2C2H5OH + 2CO2), which is how alcoholic fermentation differs from lactic acid fermentation.
A virtual set-up lets you test many temperatures quickly and push past the point where the yeast stops working. Here is what to predict before you press play.
What does temperature do to yeast fermentation?
Fermentation is a chain of reactions, each speeded up by an enzyme, so it follows the enzyme rule. OpenStax Biology 2e puts it plainly: raising the temperature generally speeds up reactions. Outside an optimal range, though, the active site binds its substrate less well, and high temperatures eventually denature enzymes.
For yeast, the clearest numbers come from growth studies. Salvadó and colleagues measured how fast 27 yeast strains grew at different temperatures. They described each strain with three "cardinal" temperatures: a minimum, an optimum and a maximum (Applied and Environmental Microbiology, 2011).
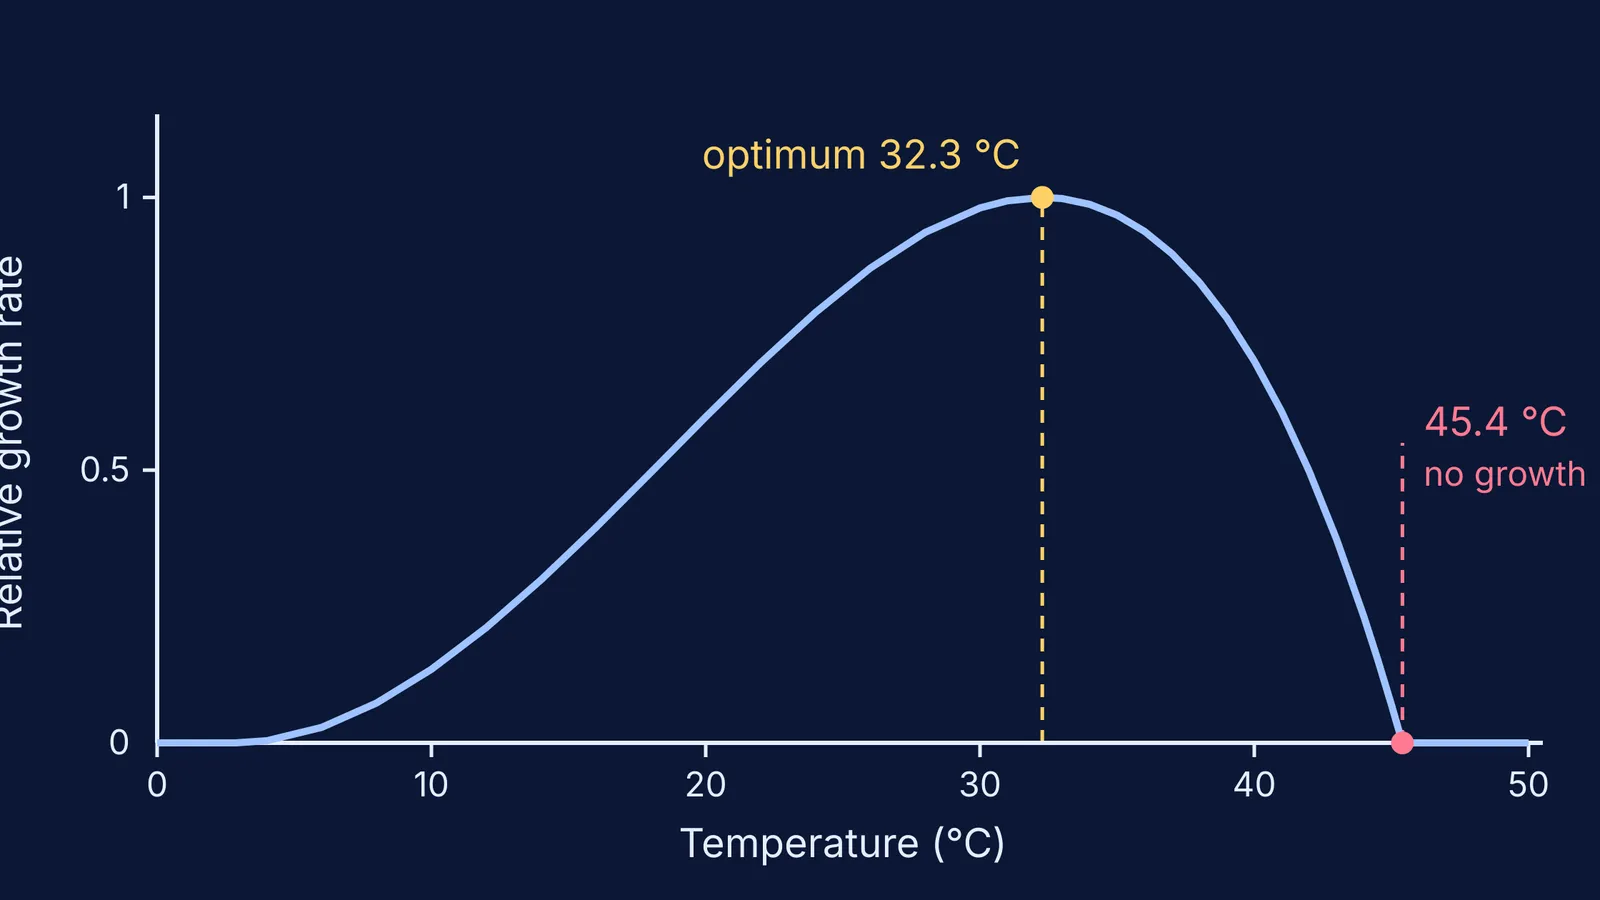
Saccharomyces cerevisiae had an optimum growth temperature of 32.3 °C and a maximum of 45.4 °C, above which it did not grow at all (Salvadó et al., 2011, abstract).
That study measured growth, not gas. Carbon dioxide output depends on how active the cells are, so predict a curve of the same shape, then test it.
How do you set up a fair yeast and balloon experiment?
Whether your bottles are real or on screen, change one thing at a time.
Independent variable: water-bath temperature. Try 10, 20, 25, 30, 35, 40, 45 and 50 °C.
Keep fixed: mass of yeast, mass of sugar, volume of water, bottle size and run time.
Dependent variable: balloon circumference at the end, or the time the balloon takes to stand upright if you want a rate.
Control: a bottle with yeast and water but no sugar.
Repeat each setting three times and use the mean.
Real water baths drift at the extremes. The Fermi Simulation Lab has interactive simulations for ideas that are easier to see than to read, and a curve with a peak is one of those ideas.
What should you predict at each temperature?
We took the mean cardinal temperatures of the ten S. cerevisiae strains in Table 2 of the 2011 study (minimum 2.8 °C, optimum 32.3 °C, maximum 45.4 °C), put them into the study's growth model, and read off each growth rate as a share of the peak:
10 °C: about 13% of the peak rate
20 °C: about 60%
25 °C: about 83%
30 °C: about 98%
32 °C: 100%, the optimum
35 °C: about 97%
40 °C: about 70%
44 °C: about 23%
46 °C and above: zero
Look at the shape. The rate climbs for nearly 30 degrees to reach its peak, then falls to zero within about 13 degrees. Your 40 °C balloon should still fill well, the 44 °C one should barely grow and the 50 °C bottle should stay flat.
Do not treat 32.3 °C as exact for your packet of yeast. Across the ten strains in that table, the optimum ran from 30.0 to 34.8 °C and the maximum from 42.0 to 46.1 °C.
Is the yeast denatured or just slowed down?
Cold only slows yeast down: warm a 10 °C bottle and it speeds up again. To check whether your 50 °C yeast was damaged or just slowed, cool that bottle to 30 °C and wait. If the balloon still stays flat, the damage did not reverse.
Long runs bring a second cost. In wine fermentations run at 15 to 35 °C, the number of live yeast cells fell at high temperatures, especially at 35 °C (Torija et al., 2003). So the temperature that gives the fastest start may not give the most gas over several days.
What happens when you change the sugar?
Now hold the temperature at 30 °C and vary the sugar. With little sugar, the yeast runs out of fuel early. More sugar means more total gas, but the rate levels off, much as an enzyme's rate levels off as substrate concentration rises.
Very high sugar works against the yeast. Some brewing fermentations start at 20 to 25% fermentable sugar, which puts yeast cells under high osmotic stress (Kumar et al., 2015). Predict which middle sugar level gives the fastest start, then test it. The same science explains why idli batter rises.
A checklist for your write-up
State the optimum from your own data, then compare it with the 32.3 °C optimum found by Salvadó et al. (2011).
Plot rate against temperature and describe each side of the peak separately.
Use "denatured" only for a bottle that stayed flat after cooling.
Name your control and say what it showed.
If the lopsided curve still feels abstract, Fermi's AI tutor can draw the figure, run the simulation and check your understanding as it goes.


