On this page
You probably met sine as "opposite over hypotenuse". That breaks past 90°: what is the opposite side of a 150° angle? The unit circle fixes this, and turns the sine graph into something you can draw from scratch.
How does the unit circle turn into the sine graph?
A unit circle has its centre at (0, 0) and radius 1, and for the point (x, y) on it at angle t, cos t = x and sin t = y (OpenStax Precalculus 2e, unit circle).
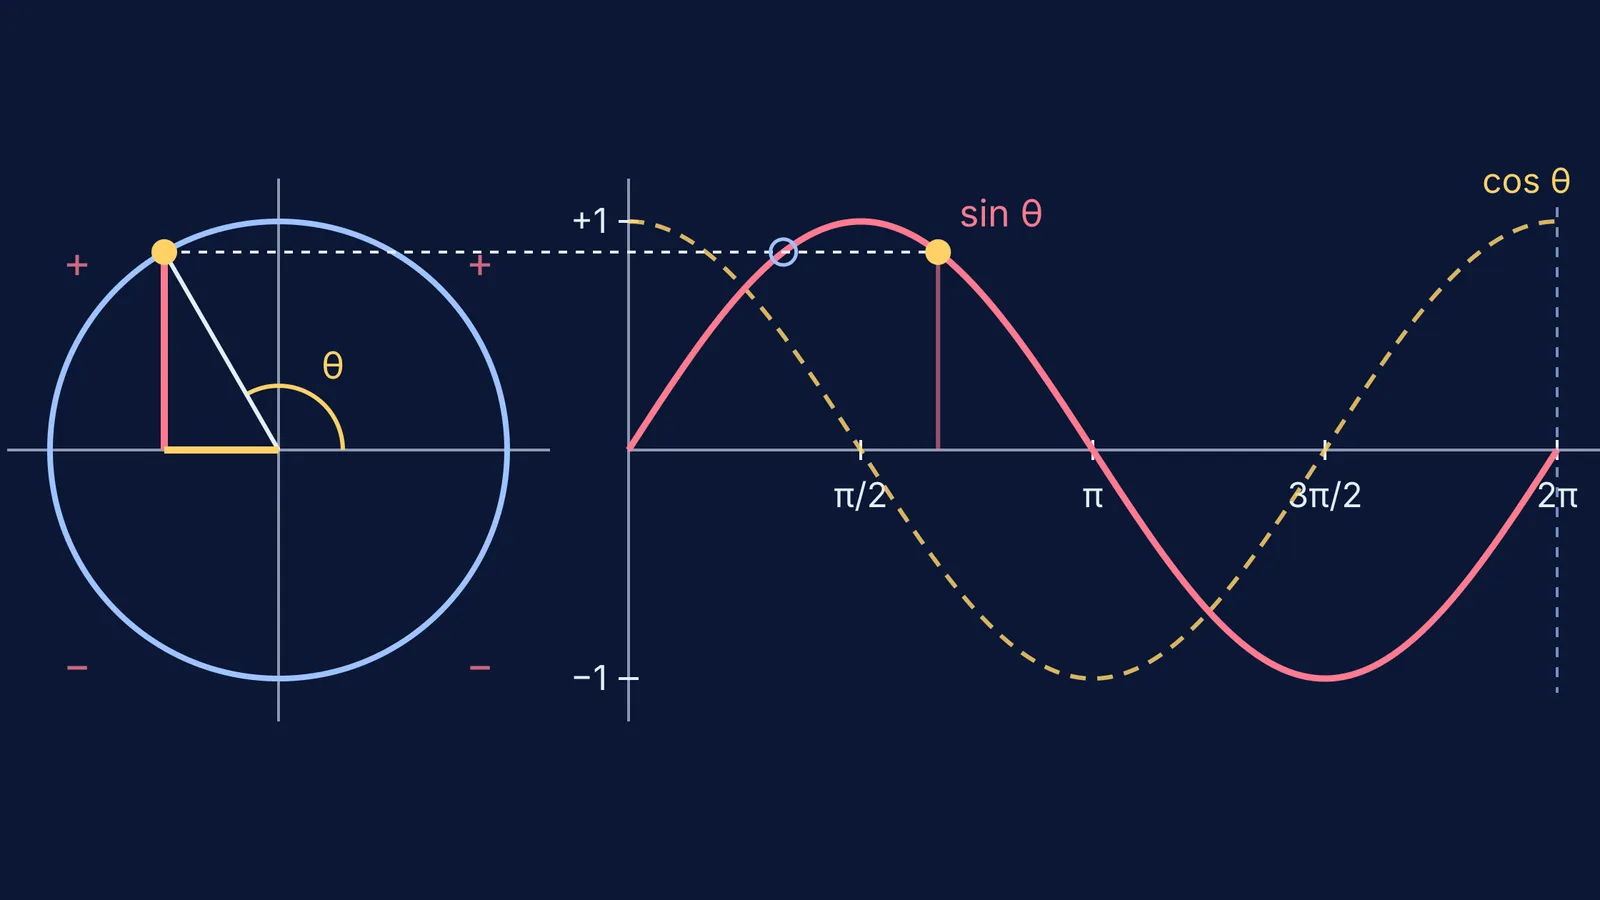
So sine is the point's height and cosine is how far right or left it sits. Move the point anticlockwise from (1, 0) and plot its height against the angle travelled, in radians: the trail is the sine graph. Plot the x-coordinate instead and you get cosine. The diagram above freezes the point at 120°.
The five stops that matter:
θ = 0: point at (1, 0). sin = 0, cos = 1.
θ = π/2: point at (0, 1). sin = 1, its peak; cos = 0.
θ = π: point at (−1, 0). sin = 0; cos = −1, its lowest.
θ = 3π/2: point at (0, −1). sin = −1, the trough.
θ = 2π: back at (1, 0), and everything starts over.
With radius 1, neither coordinate can pass 1 or −1, so the range of both functions is the interval [−1, 1] (OpenStax, graphs of sine and cosine).
What are the signs of sin and cos in each quadrant?
Read them off the point's position. The sine takes the sign of the y-values in that quadrant and the cosine takes the sign of the x-values (OpenStax Precalculus 2e).
Quadrant I (0 to π/2): right and up, so cos +, sin +.
Quadrant II (π/2 to π): left and up, so cos −, sin +.
Quadrant III (π to 3π/2): left and down, so cos −, sin −.
Quadrant IV (3π/2 to 2π): right and down, so cos +, sin −.
On the graph, sine sits above the axis for the first half-lap and below for the second. This is where the ASTC mnemonic comes from; our guide to allied angles and the ASTC rule uses it to reduce angles like 150° and 300°.
Where do sine values repeat?
Within one lap. The points at 60° and 120° mirror each other across the y-axis, so sin 120° = sin 60°; in general sin(π − θ) = sin θ. In the diagram, the dashed line meets the sine curve at the ring and the dot, at the same height. Cosine mirrors across the x-axis: cos(2π − θ) = cos θ.
Across laps. Go round again and you land on the same point, so every value comes back.
Why is the period of sine 2π and not π?
A periodic function is one where a horizontal shift P gives back the same function, f(x + P) = f(x) for every x, and sine and cosine are periodic with period 2π (OpenStax, graphs of sine and cosine). A circle of radius 1 has circumference 2π, so after 2π the point is back where it started.
Why not π? In a 2020 classroom study of drawing trigonometric graphs through the unit circle, Churun Lu'lu'il Maknun, Rizky Rosjanuardi and Al Jupri recorded some high school students giving π as the period of sine, because the curve from 0 to π looked like the curve from π to 2π (Maknun and colleagues, International Electronic Journal of Mathematics Education). But the first hump is above the axis and the second below: same shape, opposite sign. On the circle, θ + π is the opposite point, so sin(x + π) = −sin x.
The same study saw the reverse slip with tangent: students said 2π, copying sine and cosine, until a second look at the graph showed it repeating every π. Tangent is y/x, and at the opposite point both coordinates flip sign, so the ratio is unchanged.
A short unit circle drill to try tonight
Draw a unit circle and, beside it, axes from 0 to 2π with π/2, π and 3π/2 marked.
Mark the point every 30° (π/6), read its height and plot a dot at that angle. Use sin 30° = 1/2 and sin 60° ≈ 0.87.
Join the dots, then repeat with the x-coordinate for cosine.
Answer: which angles give sin = 1/2? (π/6 and 5π/6.) Where is cos negative? (Between π/2 and 3π/2.) What is sin(x + π)? (−sin x.)
Test the period: are x and x + π the same point? No, opposite. Are x and x + 2π? Yes.
Our piece on simulations versus static diagrams covers when moving pictures help, and using graphing tools to learn functions shows how to use them without skipping the thinking. The Fermi Simulation Lab has interactive simulations for ideas that are easier to see than to read. If radians are the shaky part, the Fermi Concept Library gives each concept its own lesson.
Whatever tool you use, predict first, then move the point and check.