

On this page
Before you roll anything, write down a guess. If you roll two ordinary dice 360 times, how often will each sum from 2 to 12 turn up? A common guess is that the sums come up about equally. The real answer has a clean shape, and one 6 by 6 grid explains it.
Why is 7 the most common sum of two dice?
Two dice have 36 equally likely ordered outcomes, because each of the 6 faces of the first die can pair with each of the 6 faces of the second (Mathwords: Dice).
A sum of 7 can be made in 6 of those 36 ways: 1+6, 2+5, 3+4, 4+3, 5+2 and 6+1. No other total has as many. The most common roll of two dice is 7, with probability 6/36 = 1/6, and the least common are 2 and 12, each with probability 1/36 (Wolfram MathWorld: Dice).
The key word is ordered. A red 1 with a blue 6 is a different outcome from a red 6 with a blue 1. If you count them as one, 7 seems to have only 3 ways, and the outcomes you are left with are no longer equally likely: a double such as 3+3 happens one way, but a mixed pair such as 1+6 happens two ways. This is a common slip in school dice questions.
What should you predict before you roll?
In a study of demonstrations in introductory physics classes, Catherine Crouch, Adam Fagen, Paul Callan and Eric Mazur found that students who only watched demonstrations understood the underlying concepts no better than students who saw no demonstration at all, while students who predicted the outcome first showed significantly greater understanding (American Journal of Physics, 2004). A simulation is a demonstration you run yourself, so the same habit is worth trying. We wrote more about it in how to predict, then test, with AI and a simulation.
Here is a five-minute plan:
Write the sums 2 to 12 in a column.
Next to each, write how many times you expect it in 360 rolls.
Sketch the shape you expect: flat, a hill, a triangle or a bell.
Run the simulation for 36 rolls, then 360, then 3,600 or more.
Compare with your guess and with the expected counts below, then write one sentence on what surprised you.
Any dice simulator works, even a spreadsheet. The Fermi Simulation Lab collects interactive simulations for ideas that are easier to see than to read.
How does the 6 by 6 grid explain the triangle?
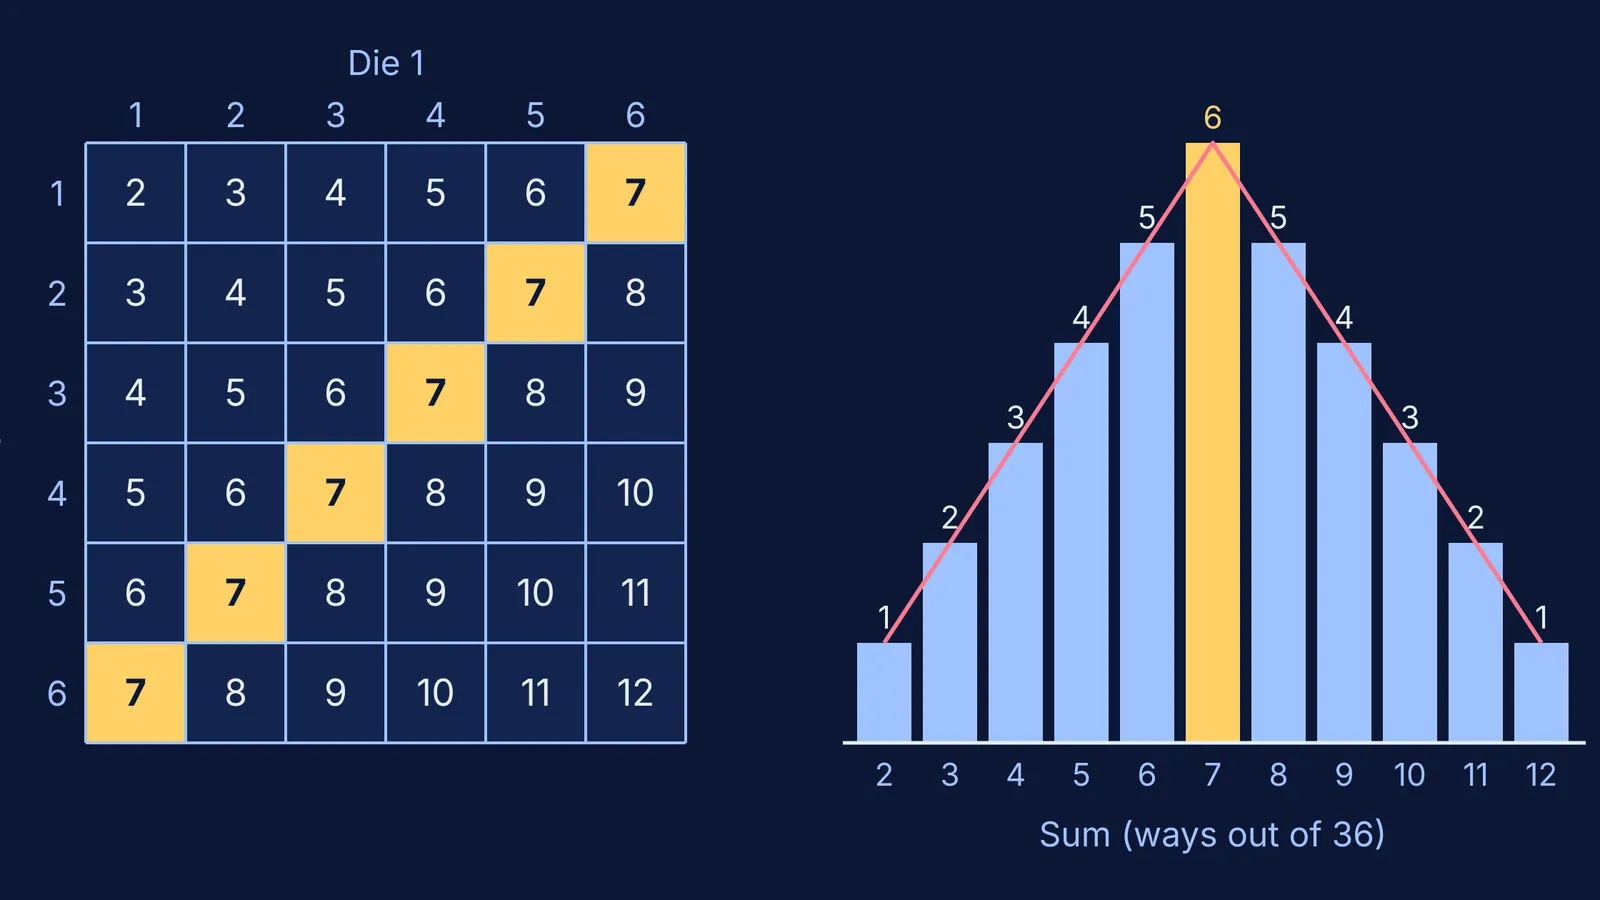
Draw a grid with the first die across the top (1 to 6) and the second die down the side (1 to 6). In each of the 36 cells, write the sum. Equal sums line up along diagonals running from bottom-left to top-right.
Now count the cells on each diagonal, from sum 2 to sum 12:
Sum 2 has 1 cell (1+1), sum 3 has 2, sum 4 has 3, sum 5 has 4, sum 6 has 5.
Sum 7 has 6 cells: the longest diagonal, running corner to corner.
Sum 8 has 5, sum 9 has 4, sum 10 has 3, sum 11 has 2, sum 12 has 1 (6+6).
That list of lengths, 1, 2, 3, 4, 5, 6, 5, 4, 3, 2, 1, is the histogram. Stand the diagonals up as bars and you get a triangle. MathWorld writes the whole pattern as one formula: the probability of a sum p is (6 − |p − 7|)/36, for p from 2 to 12 (Wolfram MathWorld).
Why straight sides? Up to 7, each step up in the sum adds one cell to the diagonal, because the diagonal can reach one row further. After 7, the edge of the grid cuts one cell off each time. That gives a triangle, not a curve.
The same grid answers other questions too, such as the distribution of the larger of two dice, where the cells group into L-shapes instead of diagonals.
How many rolls until the triangle shows up?
Multiply each probability by 360 and the expected counts for 360 rolls are 10, 20, 30, 40, 50, 60, 50, 40, 30, 20 and 10 for sums 2 to 12 (using the formula from Wolfram MathWorld).
Do not expect the simulation to hit them exactly:
36 rolls: usually lumpy. A sum may not appear at all, and 7 may not win. That is ordinary randomness, not a broken die.
360 rolls: the triangle is recognisable, with bumps.
3,600 rolls or more: the proportions settle close to 1/36, 2/36 and so on, though raw counts still wander a little.
If your 360-roll result looks off and you cannot say why, Fermi's AI tutor can notice where you are stuck and decide whether to explain, ask or show, checking your understanding as it goes.
To see what happens as you keep adding dice, and why averages drift towards a bell curve, read the central limit theorem with dice.


