

On this page
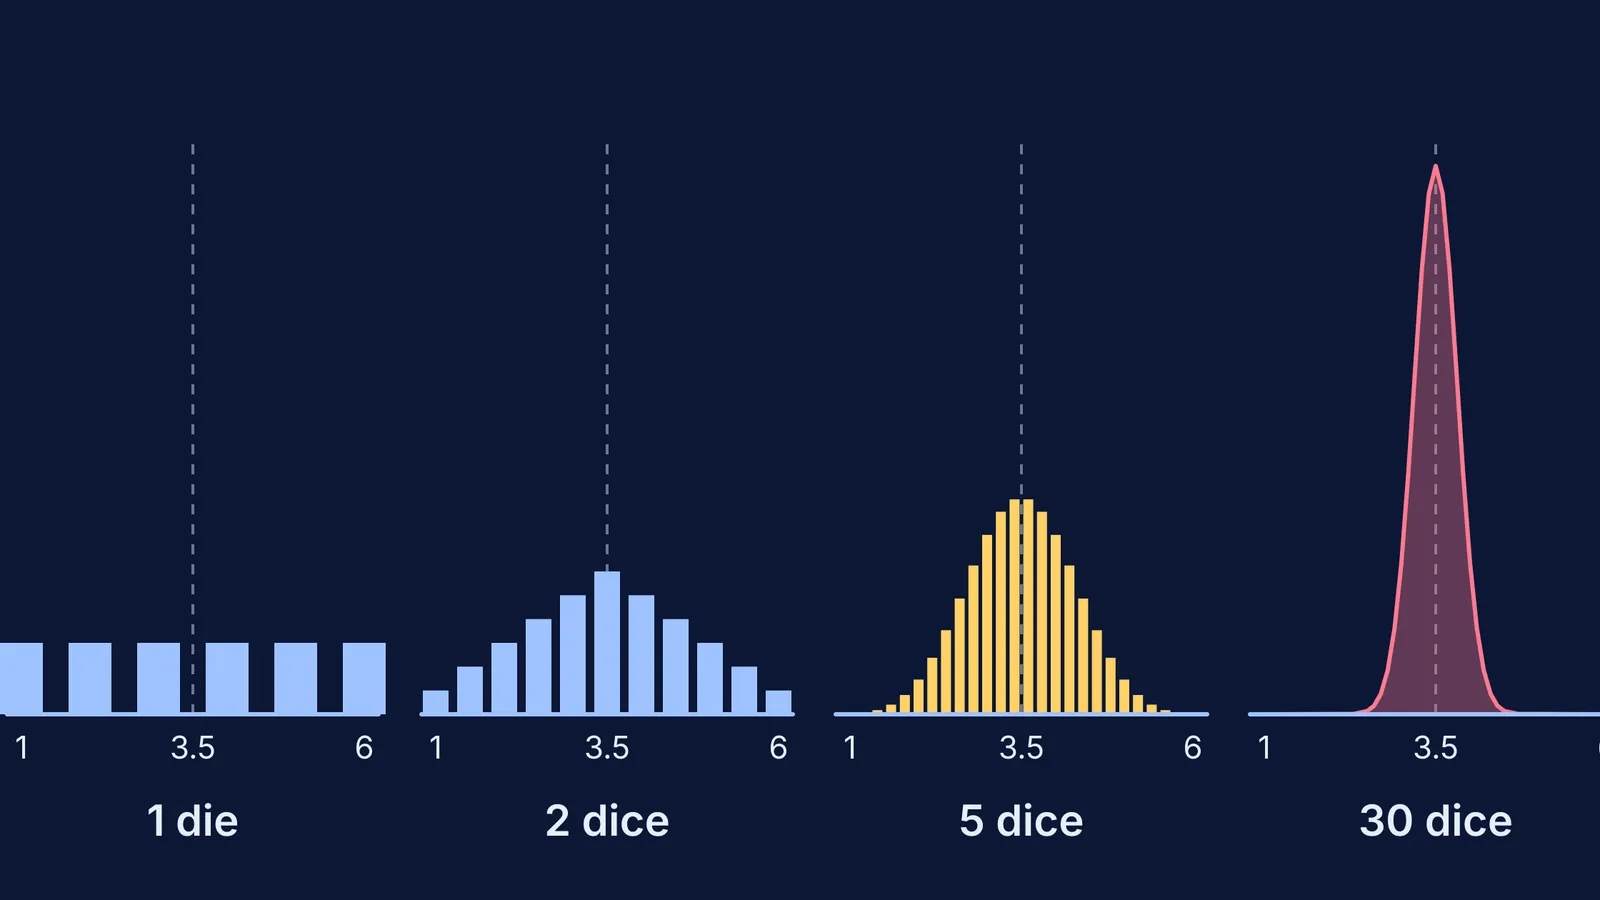
A single die is the flattest data you can find: every face from 1 to 6 is equally likely. Yet if you roll a handful of dice, take the average, and repeat that thousands of times, the averages pile up into a smooth bell. This post walks you through that experiment in four rounds, one, two, five and thirty dice, and asks you to predict the shape before each reveal. The counts for one, two and five dice are exact, so you can check any simulation you run against them.
What does the data from one die look like?
For a fair die, each value 1, 2, 3, 4, 5, 6 has probability 1/6, which makes it a discrete uniform distribution. The same page gives the mean as (a + b)/2 and the variance as ((b − a + 1)² − 1)/12.
Put in a = 1 and b = 6: the mean is 3.5 and the variance is 35/12, about 2.92, so the standard deviation σ is about 1.71.
Roll one die 10,000 times and plot the results: you get six bars of roughly equal height. No peak, no bell.
What happens when you average two dice?
Predict first: will the averages of two dice still be flat?
They are not: the sum of two dice is no longer uniform. Two dice give 36 equally likely pairs. Only one pair, (1, 1), gives an average of 1, but six pairs give an average of 3.5: (1, 6), (2, 5), (3, 4), (4, 3), (5, 2) and (6, 1). So the middle is six times as likely as either end, and the shape becomes a triangle.
The reason is simple counting. Extreme averages need every die to be extreme together; middling averages can be made in many ways, because a high roll and a low roll cancel out.
Why do five and thirty dice make a bell curve?
The central limit theorem in OpenStax Introductory Statistics explains what is going on: as the sample size n increases, sample means tend towards a normal distribution, whatever the shape of the original distribution. The mean of those averages stays at the population mean, and their standard deviation is σ/√n. The NIST/SEMATECH e-Handbook of Statistical Methods states the same result.
With five dice there are 6⁵ = 7,776 equally likely outcomes. Only 1 of them averages exactly 1 (all ones), while 780 give a sum of 17 and another 780 a sum of 18, the two middle values.
For dice, σ is about 1.71, so the spread of the average shrinks like this:
1 die: about 1.71
2 dice: about 1.21
5 dice: about 0.76
30 dice: about 0.31
Now use the empirical rule from OpenStax: for bell-shaped data, about 95% lies within two standard deviations of the mean. So about 95% of 30-dice averages should land between roughly 2.88 and 4.12, even though each single die swings from 1 to 6.
How can you run this experiment and learn from it?
In a study of physics lecture demonstrations, Crouch, Fagen, Callan and Mazur (2004) found that students who only watched understood the concepts no better than students who never saw the demonstration, while students who predicted the outcome first showed significantly greater understanding. So use this plan:
Before each round, sketch the shape you expect on paper and write down the most likely average and the range where most results will fall.
In a spreadsheet, put =RANDBETWEEN(1,6) in many cells, average each row, and make a histogram of 10,000 rows.
Compare your sketch with the result, and with the exact counts above. Where were you wrong, and why?
Change one thing: use only 1s and 6s (a two-valued "die") and repeat. Predict whether the averages still turn into a bell.
Explain to someone else why the ends of the curve thin out.
If you want to see more ideas move as you change them, the Fermi Simulation Lab has interactive simulations for the ideas that are easier to see than to read. For the formulas behind this post, read our worked problems on mean, variance and standard deviation and on probability distributions of a random variable. To build a simulation in code instead of a spreadsheet, try writing a physics simulation in Python and adapt the loop to dice.
When does the bell curve not appear?
The theorem is about averages of many independent rolls. It does not make a single die bell-shaped, and it needs each roll to be independent of the others. Thirty dice is a handy size, but the right n depends on how lopsided the original data is: a flat die settles quickly, a very skewed source needs more.
If you get stuck on why σ/√n and not σ/n, Fermi's AI tutor can work out what you already know and work through it with you, deciding whether to explain, ask or show.


