

On this page
A bigger forest holds more kinds of plants, birds and insects. The rise follows a tidy rule, and once you can read it off a graph you can estimate what happens when half a forest is cut down.
Why do bigger areas have more species?
Exploring South American jungles, the German naturalist Alexander von Humboldt saw that species richness rose with the area explored, "but only up to a limit", as the NCERT Class 12 Biology chapter on biodiversity puts it. The same chapter says the pattern holds for a wide variety of taxa, including angiosperm plants, birds, bats and freshwater fishes.
Ecologists have proposed several factors that shape the relationship, listed in this overview of the species-area relationship: the balance between species arriving and dying out, disturbance on small versus large areas, predator-prey dynamics, and individuals of one species clustering together, so a bigger area takes in more clusters. Others say we should first test whether the pattern is simply a result of random sampling.
How do you plot species against area on log axes?
On ordinary axes the species count climbs steeply, then flattens. The NCERT chapter writes the curve as S = CA^z (S species richness, A area, C a constant, z the slope). Taking logs gives log S = log C + z log A, which is just y = c + mx: a straight line.
List each island or patch with its area and species count.
Take log base 10 of both.
Plot log A on the x-axis and log S on the y-axis.
Draw the best straight line. Its slope is z; its value at log A = 0 is log C.
Switching area units shifts the line up or down: it changes C, never z.
A worked example with made-up numbers: island P covers 10 square km with 20 species; island Q covers 1,000 square km with 50. Then z = (log 50 - log 20) / (log 1000 - log 10) = (1.699 - 1.301) / 2, which is about 0.2. If your graphs still wobble, our guide on how to draw a graph in your physics practical file covers scales and best-fit lines.
What does the slope z tell you?
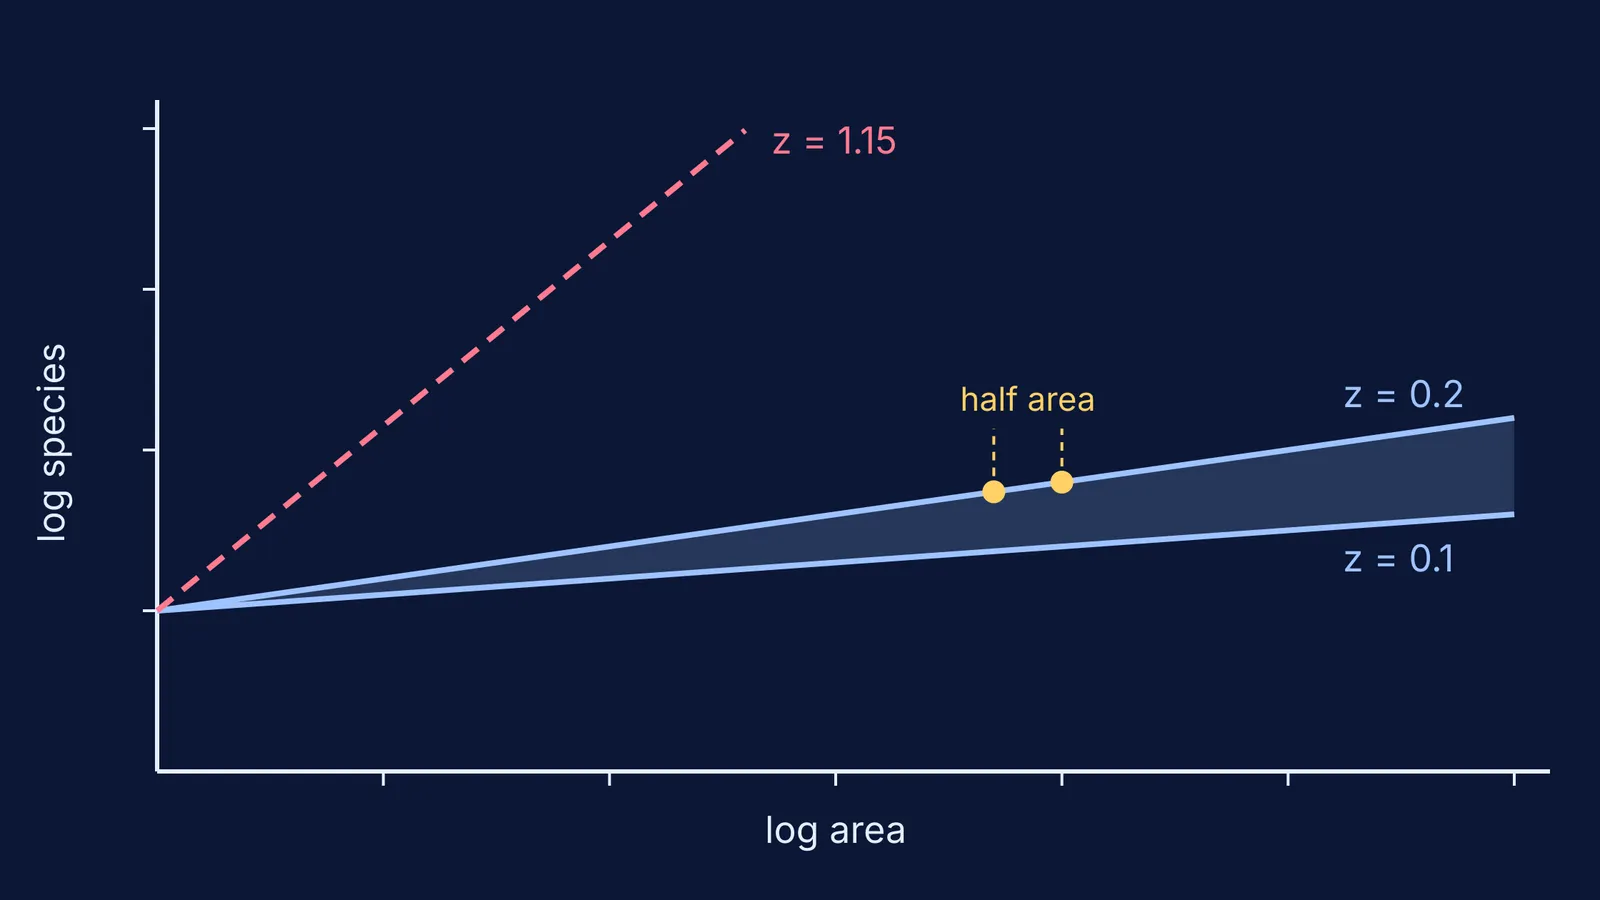
The slope z says how strongly species count responds to area: ten times the area multiplies species by 10^z. At the two ends of the range given in the NCERT biodiversity chapter, that is about 1.26 times when z = 0.1 and about 1.58 times when z = 0.2.
NCERT states that z lies in the range 0.1 to 0.2 regardless of taxonomic group or region, whether plants in Britain, birds in California or molluscs in New York state. For very large areas such as whole continents, NCERT gives much steeper slopes of 0.6 to 1.2, and 1.15 for fruit-eating birds and mammals in the tropical forests of different continents.
Real slopes vary more. A meta-analysis of 794 species-area relationships by Drakare, Lennon and Hillebrand found steeper slopes at lower latitudes and for larger organisms, and slopes that depended on sampling scheme and spatial scale. So z is measured, not a universal constant. The latitude link ties in with why the tropics have more biodiversity.
What happens to species count if you halve a forest?
S_new / S_old = (1/2)^z. C cancels, so you need only z. With the NCERT slopes:
z = 0.1: species fall to 0.933 of the original, about 7% fewer
z = 0.15: 0.901, about 10% fewer
z = 0.2: 0.871, about 13% fewer
z = 1.15: 0.451, about 55% fewer
The same NCERT chapter says the Amazon rainforest is home to more than 40,000 plant species. Assume z = 0.2 (NCERT gives no Amazon value): halving the area predicts about 40,000 x 0.871, roughly 34,800 species, a loss of about 5,200.
Treat that as an upper estimate, not a body count. Fangliang He and Stephen Hubbell argued in Nature in 2011 that running the species-area curve backwards overestimates extinctions, by more than 160% in some of their data, because the area you must remove to wipe out a species' last individual is almost always much larger than the area needed to find its first. They also warned that extinction from habitat loss is a real and growing threat.
How can you practise reading the slope?
Try this short drill:
Plot S = 10A^0.2 on ordinary axes for A = 1, 10, 100 and 1,000: S = 10, 15.8, 25.1 and 39.8, a flattening curve.
Plot the same points as (log A, log S): (0, 1), (1, 1.2), (2, 1.4), (3, 1.6), a straight line of slope 0.2.
Repeat with z = 1.15 and compare (1/2)^z for both lines.
Explain to a friend, in two sentences, why halving a forest does not halve its species.
If the curve-to-line switch feels slippery, the Fermi Simulation Lab has interactive simulations for ideas that are easier to see than to read. For gaps in the logarithm rules, the Fermi Concept Library gives each concept its own lesson.
For India's place in all this, read India's share of world biodiversity explained.


