

On this page
A poll with thousands of votes feels convincing, but whether it is right depends on how people got into the sample, not how many answered. Below you survey one virtual town three ways and check each result against a known truth.
What is sampling bias?
Sampling bias is when some people are more likely than others to end up in a sample, and those people tend to answer differently. The open textbook Bit by Bit makes the key point: a larger sample shrinks random wobble, but a large amount of haphazardly collected data does not guarantee a good estimate.
It is the same idea as accuracy versus precision in a physics practical: random error averages out over many readings, but a zero error does not.
Meet the virtual town
Our town has 10,000 adults. The question: should the market road be closed to cars on Sundays? We fixed the truth in advance: 4,000 people say yes, which is 40%.
Random sample. Draw 100 names by lottery from the full voter list and ask each one.
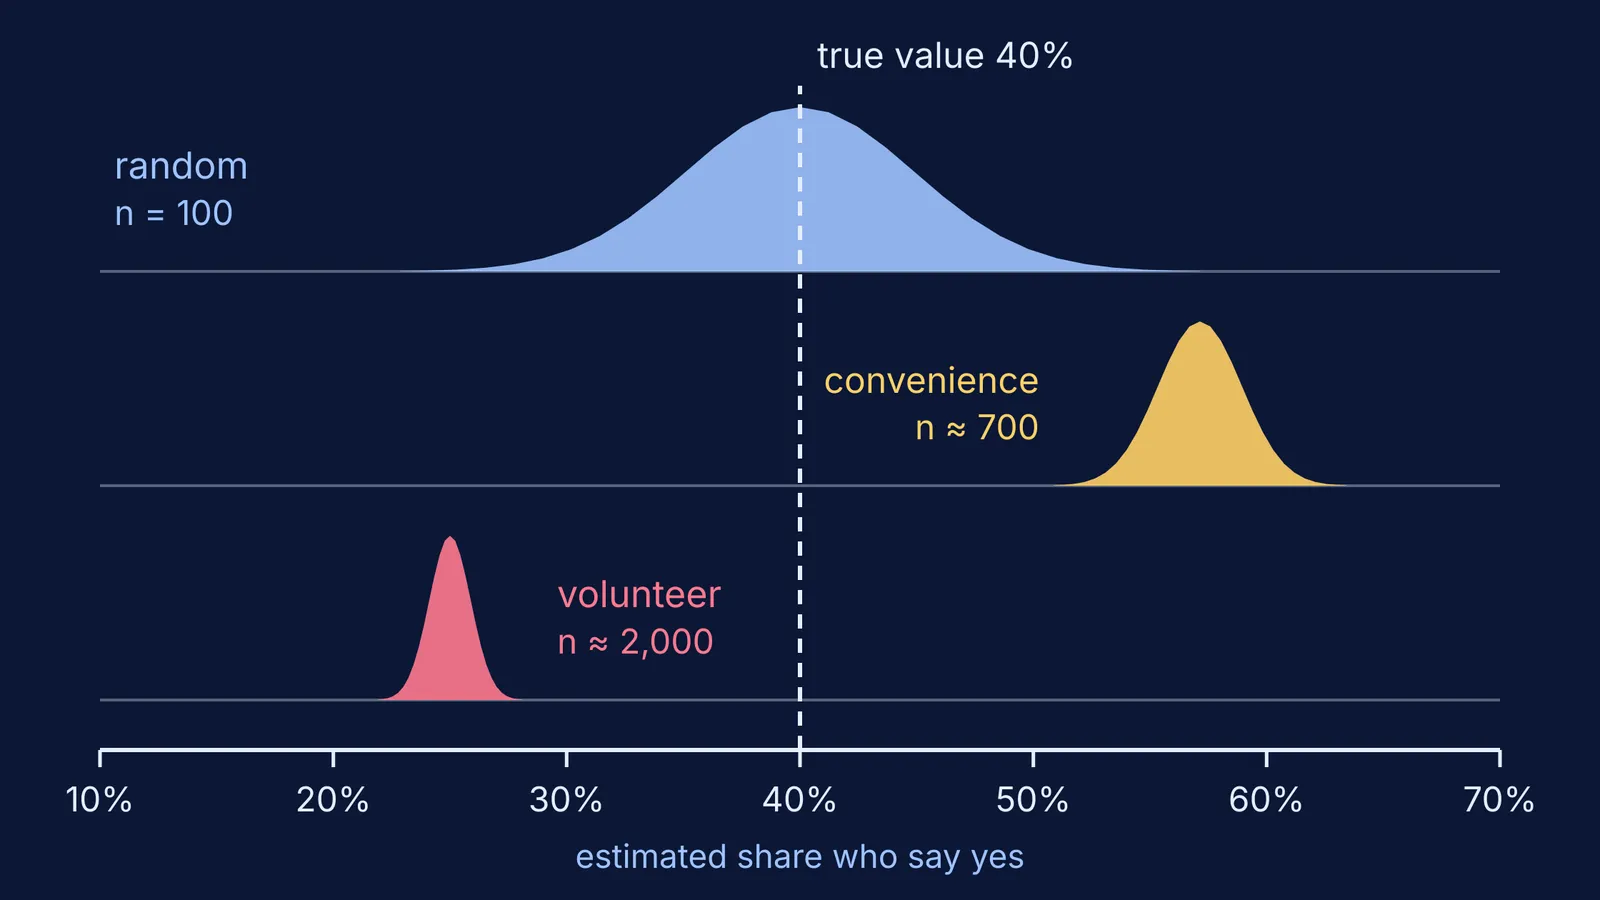
Convenience sample. Ask everyone walking past the market on a Sunday. 10% of supporters pass by but only 5% of opponents: about 700 people.
Volunteer sample. Post an online poll in the residents' group chat. Angry opponents reply more: 25% of them against 12.5% of supporters, about 2,000 replies.
Before reading on, guess each survey's yes share.
What does each survey actually find?
Random, 100 people: centred on 40%. The typical miss (standard error) is the square root of 0.4 × 0.6 ÷ 100, about 5 percentage points, so roughly 95 surveys in 100 land between 30% and 50%.
Convenience, about 700 people: you meet 400 supporters (10% of 4,000) and 300 opponents (5% of 6,000), so the estimate is 400 ÷ 700, or 57%: 17 points too high, with a wobble of only about 2 points.
Volunteer, about 2,000 replies: 500 supporters and 1,500 opponents reply, so the estimate is 25%: 15 points too low, with a wobble under 1 point.
Triple the online poll's replies to 6,000 (1,500 yes, 4,500 no): still 25%. More replies made the poll more confident, not more correct.
Why do big online polls still give biased results?
In 1936 the Literary Digest mailed 10 million ballots, got 2.4 million back and predicted that Alf Landon would beat Franklin Roosevelt; Roosevelt won in a landslide (Bit by Bit). Its lists came from its own readers, car owners and telephone users, all richer than the average voter (The Literary Digest, Wikipedia). That article cites a 1988 analysis by Peverill Squire in Public Opinion Quarterly for the finding that the main cause was non-response bias: who chose to send ballots back.
It happened again in 2021. A study in Nature compared US surveys of first-dose COVID-19 vaccine uptake with a CDC benchmark. By May 2021, a Delphi-Facebook survey with about 250,000 responses a week had overestimated uptake by 17 percentage points, and the Census Household Pulse survey, with about 75,000 a week, by 14 (abstract on arXiv). The authors showed that 250,000 respondents can give an estimate no more accurate than a simple random sample of 10.
Xiao-Li Meng explained the pattern in a 2018 paper: the gap between a sample average and the population average is the product of data quality, data quantity and how hard the problem is. Data quality is the correlation between whether a person is recorded and what they would answer. In our town it is not zero, so more replies only measure the wrong group more exactly.
Careful sampling has a long history in India too: read how P.C. Mahalanobis built India's National Sample Survey.
How can you tell if a poll is biased?
Ask these five questions of any poll.
Who could never have been asked?
Who chose to answer, and do they feel more strongly than others?
Could the reason someone got in be linked to their answer?
Is the big number being offered as proof? Size reduces wobble, not bias.
Was the result checked against a known figure, such as a census count?
When someone forwards a huge online poll, you can say: “How did people get into this poll? If they chose themselves, it tells us what the keenest clickers think, not what everyone thinks.”
Try it yourself
Build the town with chits: 40 marked yes and 60 marked no. Draw 10 at random, five times, and note each share. Then give every no chit a twin, so no-voters are twice as likely to be drawn: the yes share settles near 25%, however many you draw. To see why halving random error needs four times the data, try the margin of error sample size simulation.
If you would rather move sliders than shuffle chits, the Fermi Simulation Lab has interactive simulations for ideas that are easier to see than to read, and Fermi's AI tutor can run the simulation and check your understanding as it goes.


