

On this page
Have you ever wondered why almost every major national poll surveys around 1,000 people? In a nation of millions, it feels like a drop in the ocean, and yet this number is the gold standard for public opinion research. The reason involves a mathematical wall of diminishing returns.
Whether you are predicting an election, studying community habits, or running a margin of error sample size simulation, the math behind polling always points to the same limitation: getting a little bit more accuracy costs a whole lot more data.
What does a margin of error sample size simulation show?
The margin of error (sometimes tied to a confidence interval) measures the uncertainty in survey results caused by sampling, as the Pew Research Center explains. A poll with a margin of error of ±3 percentage points means that if a candidate has 50% support, their true support in the population likely lies somewhere between 47% and 53%.
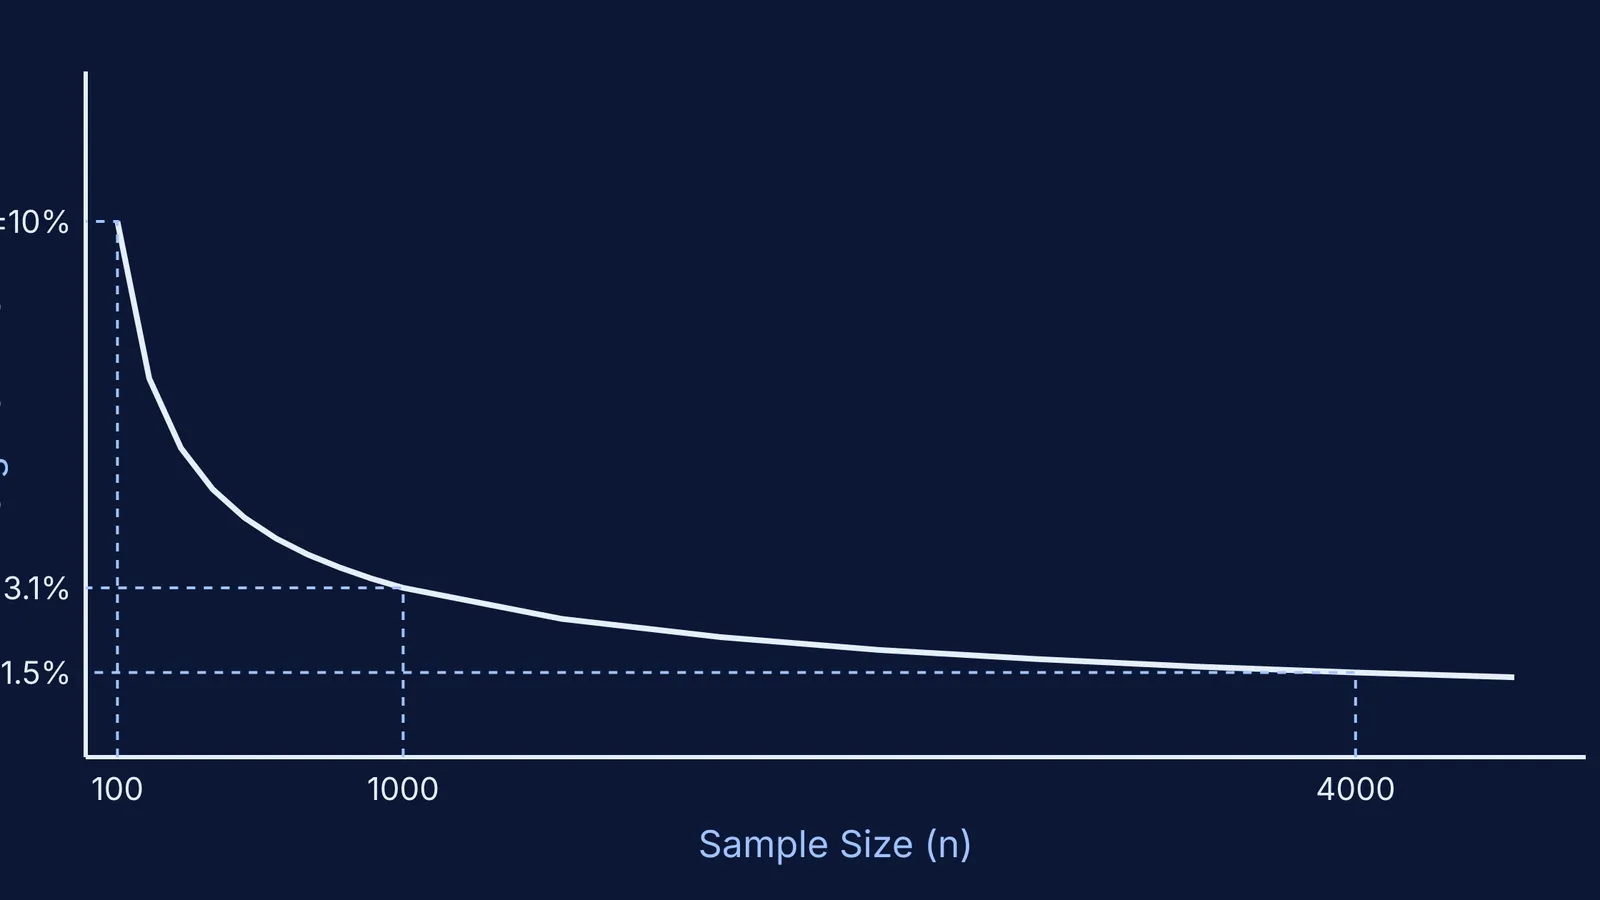
If you plot the formula on a graph, the first thing you notice is how steeply the curve drops initially before levelling out into a long tail. A typical survey of 1,067 people comes with a margin of error of roughly ±3 percentage points.
This sounds precise enough for national headlines, but it has severe limits when researchers want to look closer. If you split that data to look at a smaller demographic group, the sample size for that specific subgroup drops, sending the margin of error soaring. For instance, if you isolate a subgroup of just 160 respondents within that larger poll, the margin of error for that group alone rises to around ±8 percentage points.
Why must you quadruple the sample to halve the error?
If this error seems too large, the natural instinct is to simply interview more people. But here is the catch: because of the underlying statistics, the margin of error does not shrink on a one-to-one scale with your sample.
The mathematical formula for the margin of error divides the population variability by the square root of the sample size (n). Because n sits under a square root, doubling the sample size reduces the error by far less than half. To cut the margin of error in half, you must quadruple the sample size.
If you attempt a margin of error sample size simulation in the Fermi Simulation Lab, you can visualize this curve directly. Setting up the variables allows you to see the exact moment when the diminishing returns hit. By sliding the sample size from 1,000 to 2,000 and then to 4,000, the simulation proves that chasing near-zero error is practically impossible and highly expensive. The visual representation makes the idea easier to see than to read about in a textbook.
The formula in action: a quick numerical test
To understand exactly how the math punishes researchers seeking higher precision, let us look at the numbers. The baseline formula for a 95% confidence level often simplifies the relationship to approximately 98 / √n (when estimating a proportion around 50%).
With n = 100, the square root is 10. The margin of error is roughly 9.8%, often rounded to ±10%.
With n = 400, the square root is 20. The error drops to 4.9%. We quadrupled the people, and the error was halved.
With n = 1000, the square root is roughly 31.6. The error drops to ±3.1%.
To halve it again to ±1.55%, we need a square root of about 63.2. Squaring that gives roughly n = 4000.
Why do pollsters usually stop around 1,000 respondents?
Polling 1,000 people gives pollsters the "sweet spot" on the statistical curve. Moving from 100 respondents to 1,000 gives a large gain in precision, dropping the margin of error from about ±10% to ±3%. But surveying the next 1,000 people only shaves off less than one percentage point of error. The additional cost of reaching 3,000 more individuals simply to reduce the error margin by 1.5 points is rarely worth the financial investment.
For students exploring statistics or taking advanced maths classes, understanding nonlinear scaling—much like figuring out when ax² + bx + c is positive for all x—is critical. The relationship between sample sizes and error rates fundamentally shapes how research is funded and conducted across the world.
Whether you are studying polling behavior or learning how to insert arithmetic and geometric means in a sequence, statistics requires grasping both the mathematical formulas and the practical limits of collecting data. If you get stuck applying the square-root law to your own problem sets, Fermi's AI tutor can work out what you know and build a plan for the session, writing on a board alongside you to trace how standard deviation, confidence levels, and sample size interact.


