

On this page
A rectifier is usually the first step in turning AC from the wall socket into steady DC for electronics. In a simulation you can build it in three stages: one diode, four diodes, then a capacitor. Sketch each output before you press play.
What does a half-wave rectifier output look like?
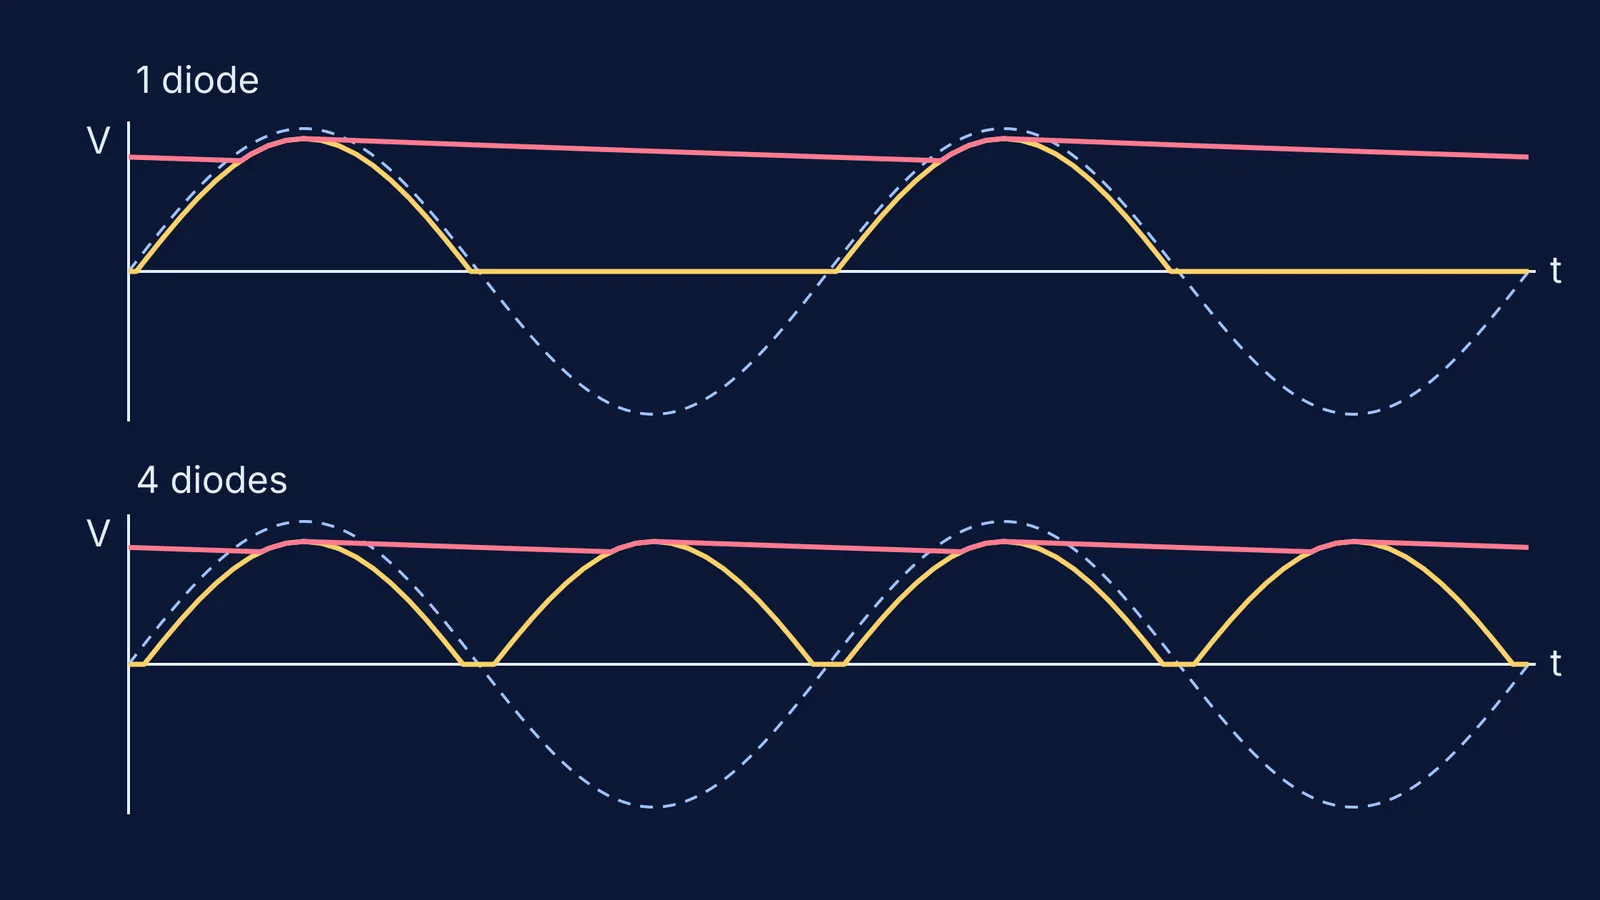
A diode lets current through in one direction only. Put one in series with an AC source and a load resistor, and the output copies the positive half of each cycle and stays flat for the negative half. The UCSB lecture-demonstration notes on the half-wave rectifier put it simply: “the diode conducts during one half cycle, and during the other half cycle, the voltage across the resistor is zero.”
Predict two details. First, the output peak sits below the input peak, because a silicon diode drops about 0.7 V while it conducts; a 10 V peak input gives about 9.3 V out in University of Kentucky lecture notes on rectifiers. Second, the output repeats once per input cycle; Indian mains is 230 V at 50 Hz (IEEE RO-MAN 2019 guide to electricity in India), so a half-wave output gives 50 bumps a second, one every 20 ms. Each gap lasts slightly over 10 ms, because the diode only conducts once the input passes about 0.7 V. Here is why India uses 50 Hz AC.
Why does a full-wave rectifier ripple at twice the frequency?
A bridge rectifier uses four diodes. According to the UCSB bridge rectifier demonstration, “on each half cycle, the load is in series with one pair of diodes that are forward biased, while the other pair is reverse biased.” Current flows through the load the same way every time, so the negative half reappears as a second positive bump. The same page notes that the ripple frequency is twice the input (120 Hz on its 60 Hz supply), so on 50 Hz mains you get 100 bumps a second, one every 10 ms.
The cost is two diodes in every path, so the peak drops by about 1.4 V instead of 0.7 V, and the output stays at zero while the input is between −1.4 V and +1.4 V, a dead zone shown on the transfer graph in the Kentucky rectifier notes.
What does a smoothing capacitor do to the output?
Put a capacitor across the load and the output stops falling to zero. It charges to the peak, then the diodes switch off and it discharges slowly through the load until the next peak tops it up. The Kentucky rectifier notes give the ripple, the peak-to-trough wobble, as roughly ΔV ≈ Vp/(f·R·C) for a half-wave rectifier, where Vp is the output peak, R the load and C the capacitance.
With a bridge, the capacitor only has to hold up for half a cycle, so the same notes give ΔV ≈ Vp/(2f·R·C): the same capacitor and load give about half the ripple. A bigger capacitor or a lighter load (bigger R) means less ripple. The slow sag is the same exponential discharge as in our RC circuit charging simulation guide.
A worked example to check your simulation
Set up a 10 V peak, 50 Hz source, silicon diodes (about 0.7 V each), a 1 kΩ load and a 470 µF capacitor. The ripple formulas in the Kentucky rectifier notes predict:
One diode, no capacitor: humps peaking near 9.3 V, one every 20 ms, with the output at zero for a little over half of each cycle.
Four diodes, no capacitor: humps peaking near 8.6 V, one every 10 ms, with a flat step just under 1 ms long at each zero crossing.
One diode with the capacitor: ΔV ≈ 9.3 ÷ (50 × 1000 × 0.00047) ≈ 0.40 V, so the output wobbles between about 8.9 V and 9.3 V.
Four diodes with the capacitor: ΔV ≈ 8.6 ÷ (100 × 1000 × 0.00047) ≈ 0.18 V, between about 8.4 V and 8.6 V.
Your simulated ripple should be slightly smaller, because the formula assumes the capacitor discharges for the whole gap between peaks. If the peaks show no drop at all, the simulation is using ideal diodes. For the average and RMS of the unsmoothed output, see RMS and average value of half-wave rectified AC.
What should you predict before you press play?
Write these down, then check each case:
The shape: which halves of the input survive with one diode, and with four?
The peak: how far below the input peak, and why does the bridge lose more?
The ripple frequency: 50 Hz or 100 Hz, before and after the capacitor?
The ripple size: what happens if you double C, or halve R?
The dead zone: where is the bridge output flat even though the input is not zero?
The Fermi Simulation Lab has interactive simulations for ideas that are easier to see than to read, and Fermi's AI tutor can run the simulation alongside you and check your understanding as it goes.
Start with one diode, sketch first, and only then press play.


