

On this page
The snowshoe hare and the Canada lynx are the textbook case. The Government of the Northwest Territories says hare populations across most of the boreal forest go through a cycle that lasts 8-11 years. It also says the lynx decline follows the hare crash after a lag of one to two years, because lynx keep eating well for a while on starving hares.
Charles Elton and Mary Nicholson analysed it in The ten-year cycle in numbers of the lynx in Canada (Journal of Animal Ecology, 1942). Below, you will run the simplest model, make three predictions, and check them against a field experiment.
What is the Lotka-Volterra predator-prey model?
It is two linked equations, written down separately by Alfred Lotka in 1920 and Vito Volterra in 1926. With H for hares and L for lynx:
dH/dt = aH - bHL: hares breed at rate a and get eaten at a rate set by how often hares and lynx meet.
dL/dt = dHL - gL: lynx grow when they catch hares and die at rate g without them.
Set a simulation to a = 1 per year, b = 0.1, d = 0.02 and g = 0.5 per year. The populations balance where neither changes: H = g/d = 25 hares and L = a/b = 10 lynx (per unit area). Start away from that point and the model never settles.
The model has no weather and no disease. The cycle comes only from the feedback between the two species.
How long is the lag between hare and lynx peaks?
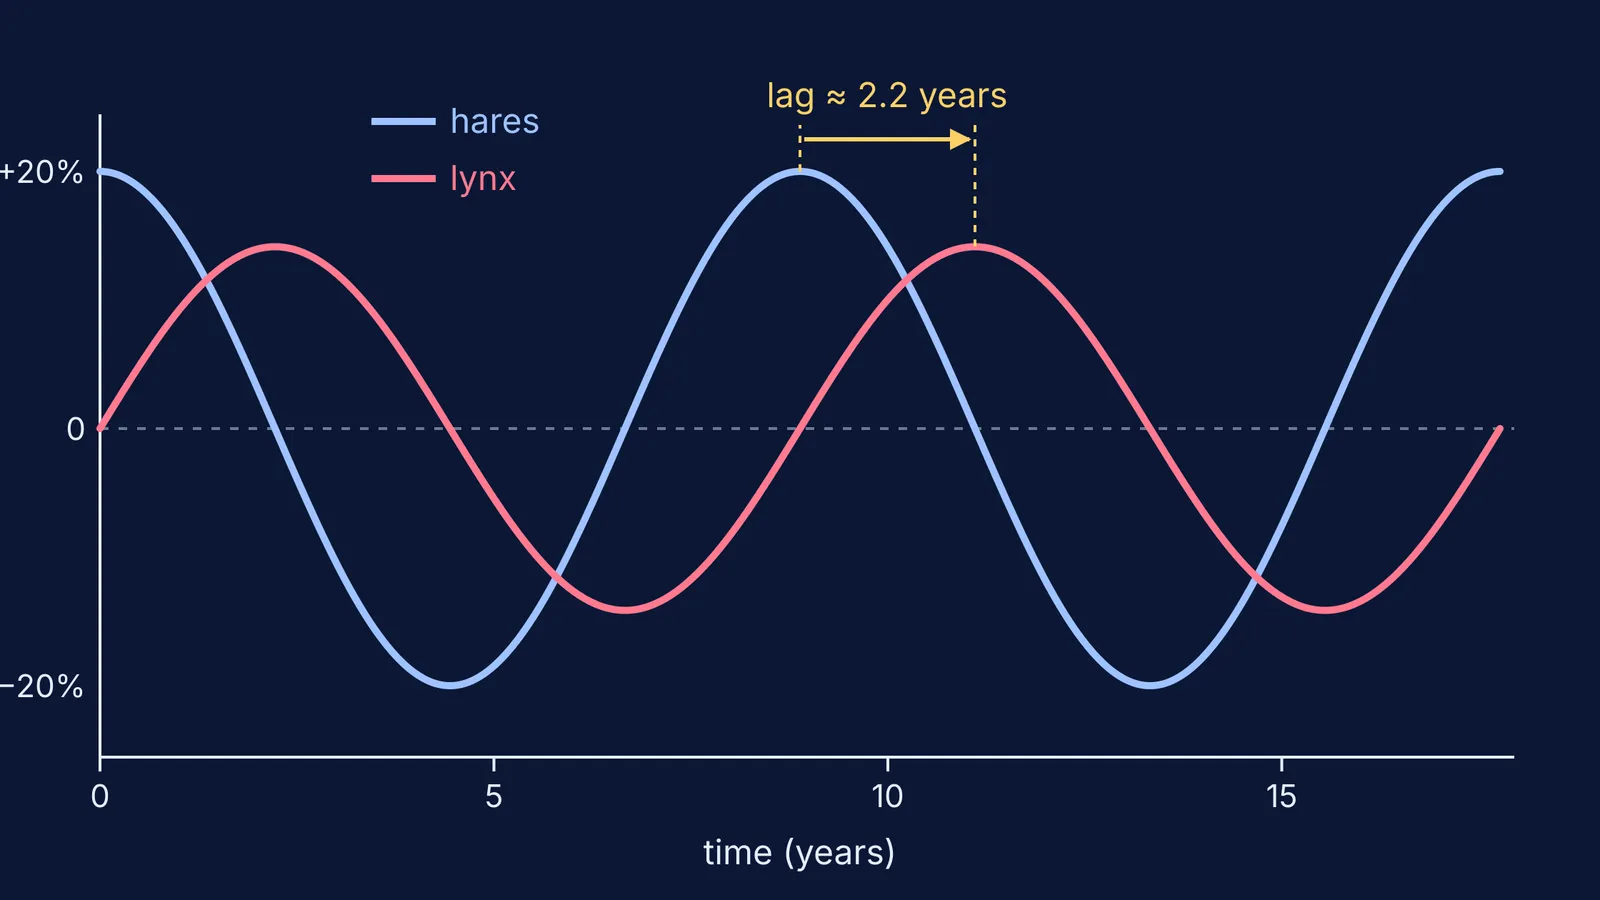
Prediction 1: before you press play, write down how many years the lynx peak trails the hare peak.
Near the balance point the maths can be solved exactly. The cycle length is 2π/√(ag), which is 2π/√0.5, or about 8.9 years for these numbers. Lynx peak a quarter of a cycle after hares, so about 2.2 years later.
Why a quarter? Lynx rise whenever there are more than 25 hares. The hare peak sits halfway through that stretch, so lynx keep rising until hares fall back to 25, a quarter cycle on.
Compare it with our LC oscillation simulation, where energy swaps back and forth, or sketch the H-L direction arrows as in predicting solution curves from slope fields.
What happens if you remove the predators?
Prediction 2: set L = 0. Do hares level off?
In the model they do not. With no lynx, dH/dt = aH, so hares multiply by e (about 2.7) every year: 25, then about 68, then about 185, with no ceiling. That hints the model is missing food.
A real experiment tested this. In Krebs and colleagues' 1995 Science study, the team ran 8 years of trials on 1-square-kilometre areas in the Yukon. Keeping out mammal predators doubled hare density during the cyclic peak and decline.
What happens if you add food for the prey?
Prediction 3: raise a from 1 to 1.5, as if the hares had more to eat. Which average goes up?
You might guess hares. The model says lynx. Because ln H returns to its starting value after each full loop, the average of a - bL over a cycle must be zero. So average lynx = a/b, which rises from 10 to 15. Average hares stay at g/d = 25. The cycle also gets shorter: 2π/√0.75 is about 7.3 years. Extra prey food ends up as extra predators.
Real hares did not follow the simple model. In the same Krebs study, adding food tripled hare density, and food plus predator removal raised it 11-fold. The authors suggest that plants, hares and predators interacting together generate the cycle.
Read Rosenzweig's Paradox of enrichment. For a chance-driven contrast, try our genetic drift simulation for small populations.
A 15-minute plan to run it yourself
Run the base values. Note the hare peak year and the lynx peak year. Is the gap close to 2.2 years?
Start very close to 25 hares and 10 lynx. The loop shrinks, but the cycle length stays near 8.9 years.
Start far away, for example 60 hares and 2 lynx. The peaks get spikier, and the lag is no longer exactly a quarter of the cycle.
Set lynx to zero, then raise a. For each change, write your prediction first and the result next to it.
Explain one surprise aloud in two sentences.
If the curves are hard to picture from equations alone, the Fermi Simulation Lab has interactive simulations for ideas that are easier to see than to read. If a result surprises you, Fermi's AI tutor can work out what you already know and decide whether to explain, ask or show the next step.


