On this page
Before you plot anything, make a guess. Take x = 0.5. Which is biggest: x², x³ or x⁴? Write it down first.
Many students pick x⁴. With whole numbers above 1, a higher power always gave a bigger answer. Between 0 and 1 that habit gives exactly the wrong order.
Which is biggest between 0 and 1: x², x³ or x⁴?
For every x strictly between 0 and 1, x² > x³ > x⁴. Try three values:
x = 0.1: x² = 0.01, x³ = 0.001, x⁴ = 0.0001
x = 0.5: x² = 0.25, x³ = 0.125, x⁴ = 0.0625
x = 0.9: x² = 0.81, x³ = 0.729, x⁴ = 0.6561
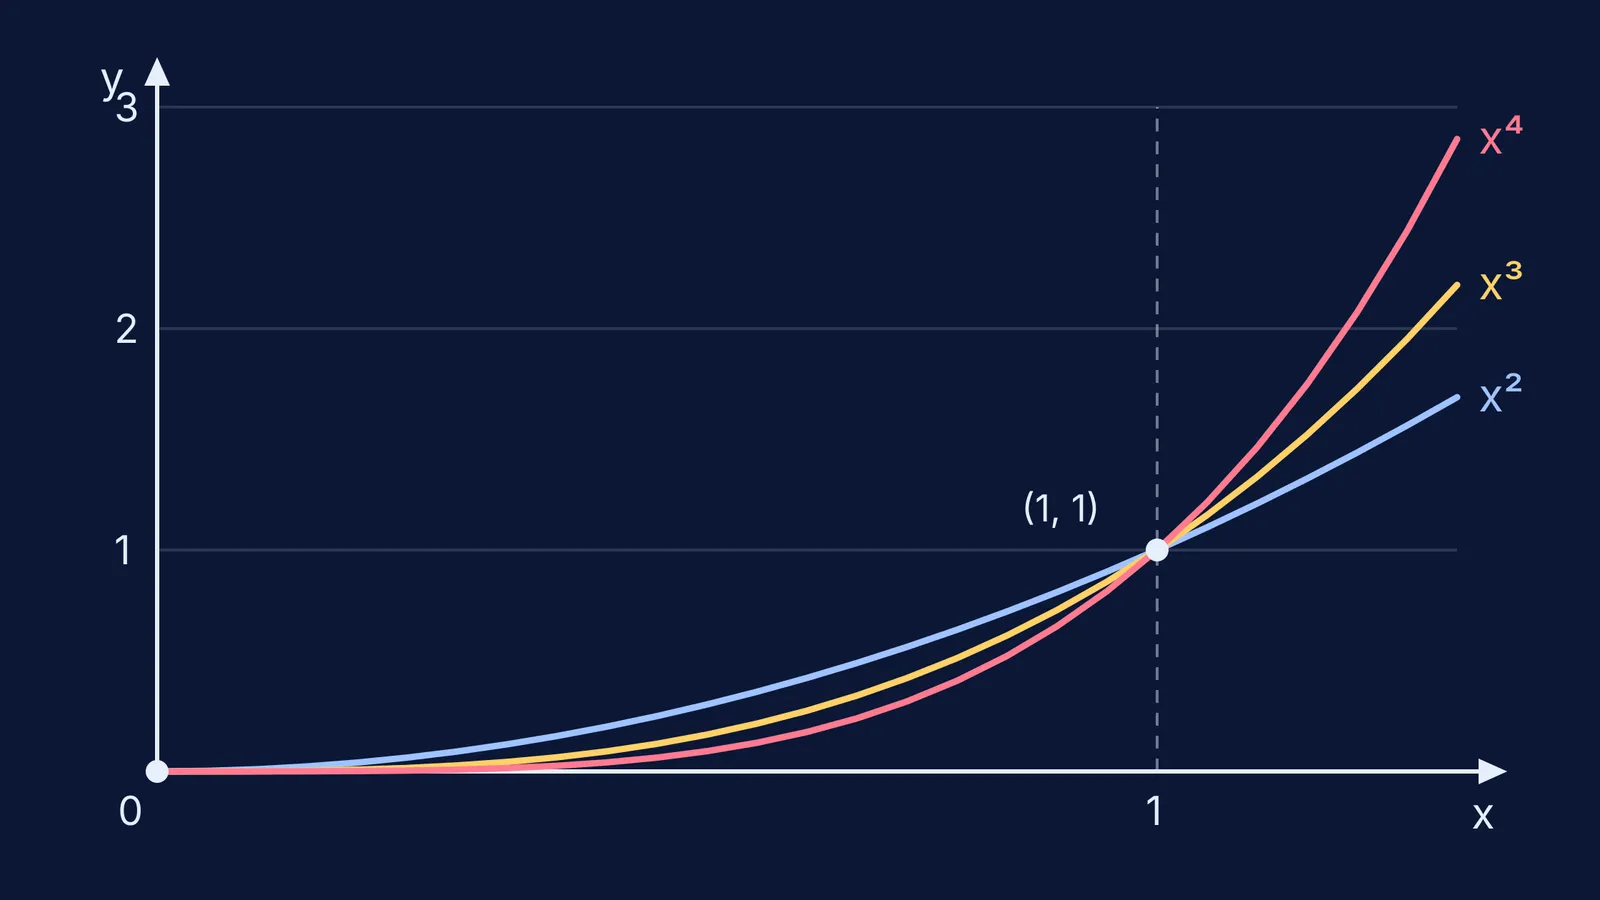
So on this stretch x⁴ is the smallest. On a graph, the higher the power, the more closely the curve hugs the x-axis before it climbs to meet the others.
Why does a higher power make a number smaller between 0 and 1?
Each new power is the old one multiplied by x once more: x³ = x² × x and x⁴ = x³ × x. That is just the same-base rule from the laws of exponents, where powers of the same base add.
Multiplying by a number less than 1 always shrinks a positive number. Half of a half is a quarter; half of that is an eighth. Every extra factor of x takes a fraction of what you had, so the result keeps falling.
You can show it in one line. x² − x³ = x²(1 − x), which is positive when 0 < x < 1 and negative when x > 1. The same works for x³ − x⁴ = x³(1 − x).
What happens at 0, at 1 and beyond 1?
At x = 0 all three are 0, and at x = 1 all three are 1, because 1 multiplied by itself stays 1. So the curves meet at (0, 0) and (1, 1), and nowhere else for x ≥ 0.
Past 1, the order flips. At x = 1.5 you get 2.25, 3.375 and 5.0625; at x = 2 you get 4, 8 and 16. Now each extra factor of x is bigger than 1, so it grows the number.
The OpenStax College Algebra chapter on power functions describes this pattern: as the power increases, the graphs flatten near the origin and become steeper away from the origin. If you want to see what happens when powers race against eˣ and ln x, read which grows faster, xⁿ or eˣ.
What about negative values of x?
The same OpenStax chapter notes that even powers are symmetric about the y-axis and odd powers are symmetric about the origin. In practice, x² and x⁴ give the same value at −x as at x, so they stay positive, while x³ flips sign and turns negative. Our post on negative numbers raised to even and odd powers walks through the sign rule.
In full:
x < −1: x⁴ > x² > x³ (at x = −2: 16, 4, −8)
−1 < x < 0: x² > x⁴ > x³ (at x = −0.5: 0.25, 0.0625, −0.125)
0 < x < 1: x² > x³ > x⁴
x > 1: x⁴ > x³ > x²
How do you predict, plot and compare in 10 minutes?
In a study of physics lecture demonstrations in the American Journal of Physics, Crouch, Fagen, Callan and Mazur (2004) found that students who only watched a demonstration understood the idea no better than students who did not see it, while students who predicted the outcome first showed significantly greater understanding. You can borrow the same habit at your desk:
Predict. Sketch all three curves from 0 to 1.5 on one set of axes without calculating, and write the order you expect at x = 0.5 and at x = 2.
Compute. Fill in values at x = 0, 0.25, 0.5, 0.75, 1, 1.25 and 1.5. At 0.75, for example, you get 0.5625, 0.4219 and 0.3164.
Plot. Use a large scale, say 10 cm for one unit, or the curves crowd together. Give each its own colour.
Compare. Lay your sketch beside the plot and circle every place it was wrong, usually near 0 and just past 1.
Explain. Write one sentence saying why the order flips at 1, using the words "multiplying by a number less than 1".
If you would rather drag x along the axis and watch the values change, try the Fermi Simulation Lab, interactive simulations for ideas that are easier to see than to read. And if power functions themselves feel shaky, the Fermi Concept Library has a lesson for every concept in mathematics, each with its place in the map.
Keep the sheet where your guess went wrong: that is the page worth revising from.