

On this page
Mendel's pea plants were either tall or dwarf. People are not: any Class 11 classroom shows every height, with most students in the middle. You can see why by adding genes to a model one at a time.
Why does height show continuous variation?
NCERT's Class 12 biology chapter Principles of Inheritance and Variation defines polygenic traits as traits generally controlled by three or more genes, and gives human height and skin colour as examples. In a polygenic trait, the effect of each allele is additive: the phenotype reflects how many contributing alleles you carry, not which single allele dominates. The same NCERT section adds that polygenic inheritance also takes the influence of environment into account.
Real height involves far more than three genes. A 2022 study in Nature by Loïc Yengo and colleagues, using data from 5.4 million people, found 12,111 independent genetic variants significantly associated with height. Together those variants explained about 40% of the variation in height in people of European ancestry, but only around 10 to 20% in other ancestry groups. The authors say the gap is likely due to population differences in how common the variants are and which are inherited together.
The idea is old. In a paper titled The Correlation between Relatives on the Supposition of Mendelian Inheritance, the statistician R. A. Fisher set out to explain the human measurements biologists had recorded, which closely follow the normal curve, through Mendelian inheritance.
How many phenotype classes do you get with each extra gene?
Here is a toy model you can work through on paper before you open any simulation. Each gene has two alleles. A capital-letter allele adds 5 cm to a baseline of 150 cm; a small-letter allele adds nothing. Cross two parents who are heterozygous for every gene (AaBb..., like an F1 hybrid) and count the offspring by how many capital alleles they carry. These numbers are made up for the model; real genes have unequal and much smaller effects.
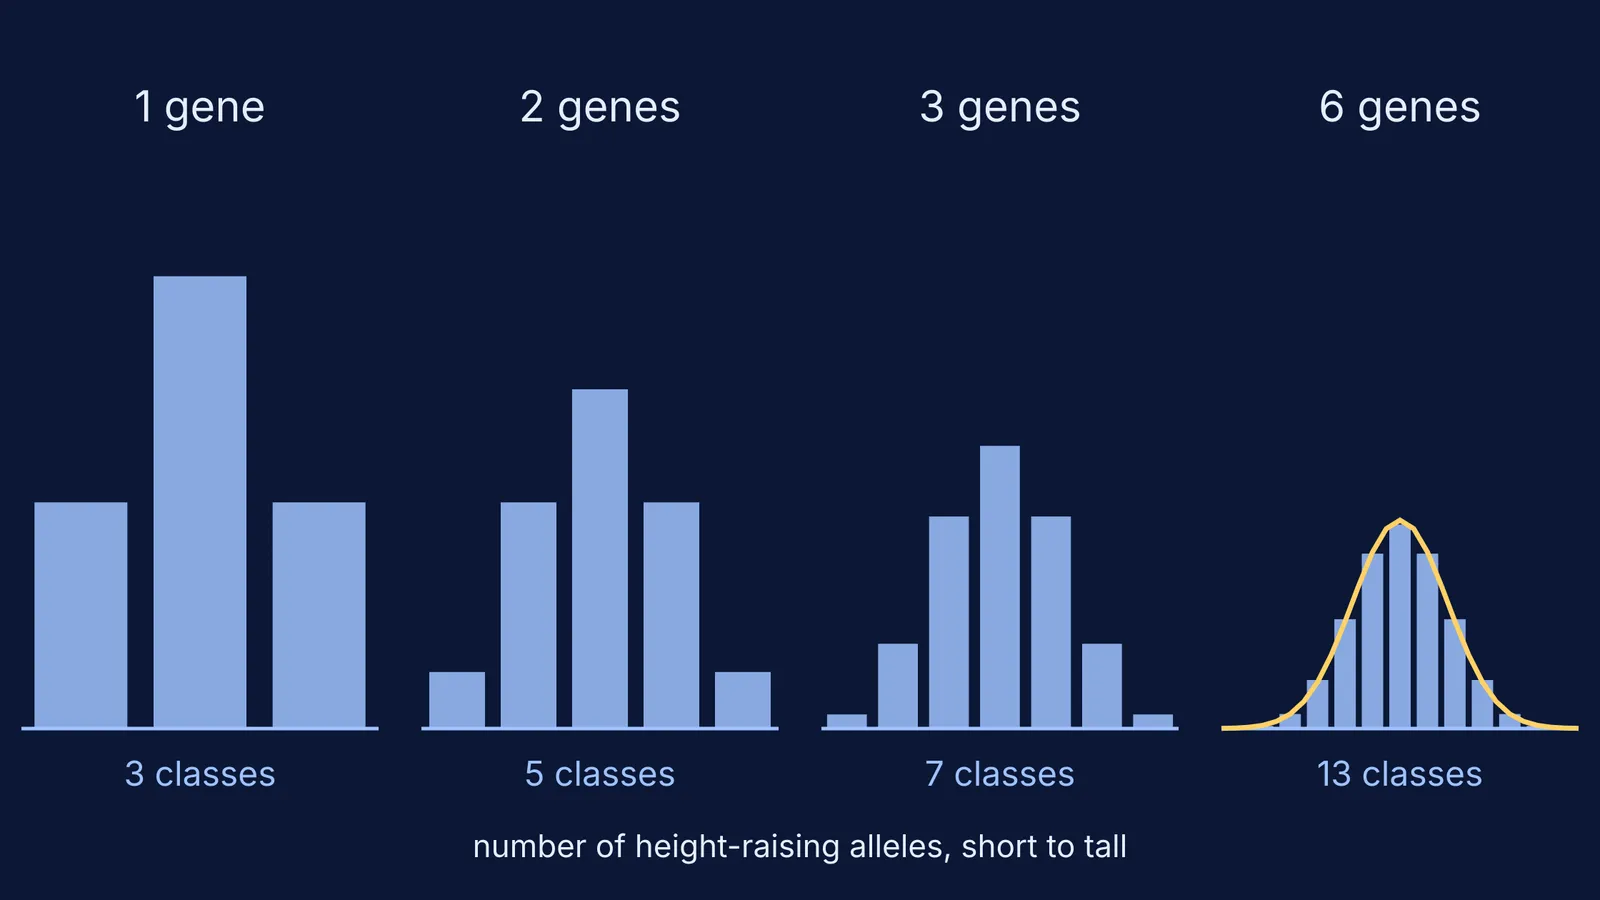
With n genes, each child carries between 0 and 2n capital alleles, so there are 2n + 1 phenotype classes. The share of children in each class follows the binomial coefficients, which is why the rows of Pascal's triangle appear.
1 gene: 3 classes in the ratio 1:2:1 (150, 155 and 160 cm).
2 genes: 5 classes in the ratio 1:4:6:4:1, out of 16.
3 genes: 7 classes in the ratio 1:6:15:20:15:6:1, out of 64; the middle class alone holds 20 of every 64 children.
6 genes: 13 classes, and each extreme is only 1 in 4,096.
10 genes: 21 classes, and each extreme is about 1 in a million (1 in 1,048,576).
The 1:2:1 ratio for one gene is the same one you meet in incomplete dominance in snapdragons, because there too each allele adds a little colour instead of one masking the other.
Why does the histogram turn into a bell curve?
As you add genes, the classes multiply and the extremes become rare, because there is only one way to inherit all tall alleles but many ways to inherit half of them. That is the binomial distribution heading towards the normal curve, the same shape you see when you toss many coins, as in our binomial distribution simulation guide.
The environment then fills in the gaps. Nutrition and health shift each person a little up or down, so the neat 5 cm steps blur into a continuous spread. That is why a real height chart has no visible classes at all.
How do you run this as a prediction experiment?
Use a simulation, a spreadsheet or coins (one toss per allele).
Predict first: write down how many classes you expect for 1, 2, 3 and 6 genes, and the fraction in the tallest class.
Run 1 gene with 20 offspring. Notice that a small sample rarely gives an exact 1:2:1, the same effect described in why small families often miss the 3:1 ratio.
Add genes one at a time with 1,000 offspring each. Count the classes and compare with 2n + 1.
Turn on an environmental spread of a few centimetres and watch the gaps between bars disappear.
Explain in one sentence why the tallest class shrinks so fast.
If you would rather drag a slider than toss coins, the Fermi Simulation Lab has interactive simulations for ideas that are easier to see than to read, and the AI tutor checks your understanding as it goes.
What does this model leave out?
Real height genes do not add equal amounts, some alleles show dominance, and environment matters a lot. A Scientific American explainer reports that 60 to 80 percent of the difference in height between individuals is attributed to genetic factors, with estimates varying between populations. That figure describes differences across a group, not how much of one person's height came from their genes.
Next time a question asks why height varies continuously, sketch the 1, 2 and 3 gene histograms side by side. The answer draws itself.


