

On this page
If you cross a red flower with a white flower, you might expect the offspring to be red, assuming red is the dominant trait. This is what Gregor Mendel saw when he bred pea plants. However, if you perform this cross with snapdragons, you get a garden full of pink flowers.
This apparent blending of traits is a classic example of incomplete dominance. The original genetic instructions have not merged or disappeared, but they express themselves differently than Mendel's standard rules would predict.
What happens in the F1 generation?
Incomplete dominance (also called partial dominance or intermediate inheritance) occurs when the phenotype of the heterozygous genotype is distinct from and often intermediate to the phenotypes of the homozygous genotypes (Wikipedia)). In snapdragons (Antirrhinum majus), flower colour is determined by two alleles: one for red (R) and one for white (r).
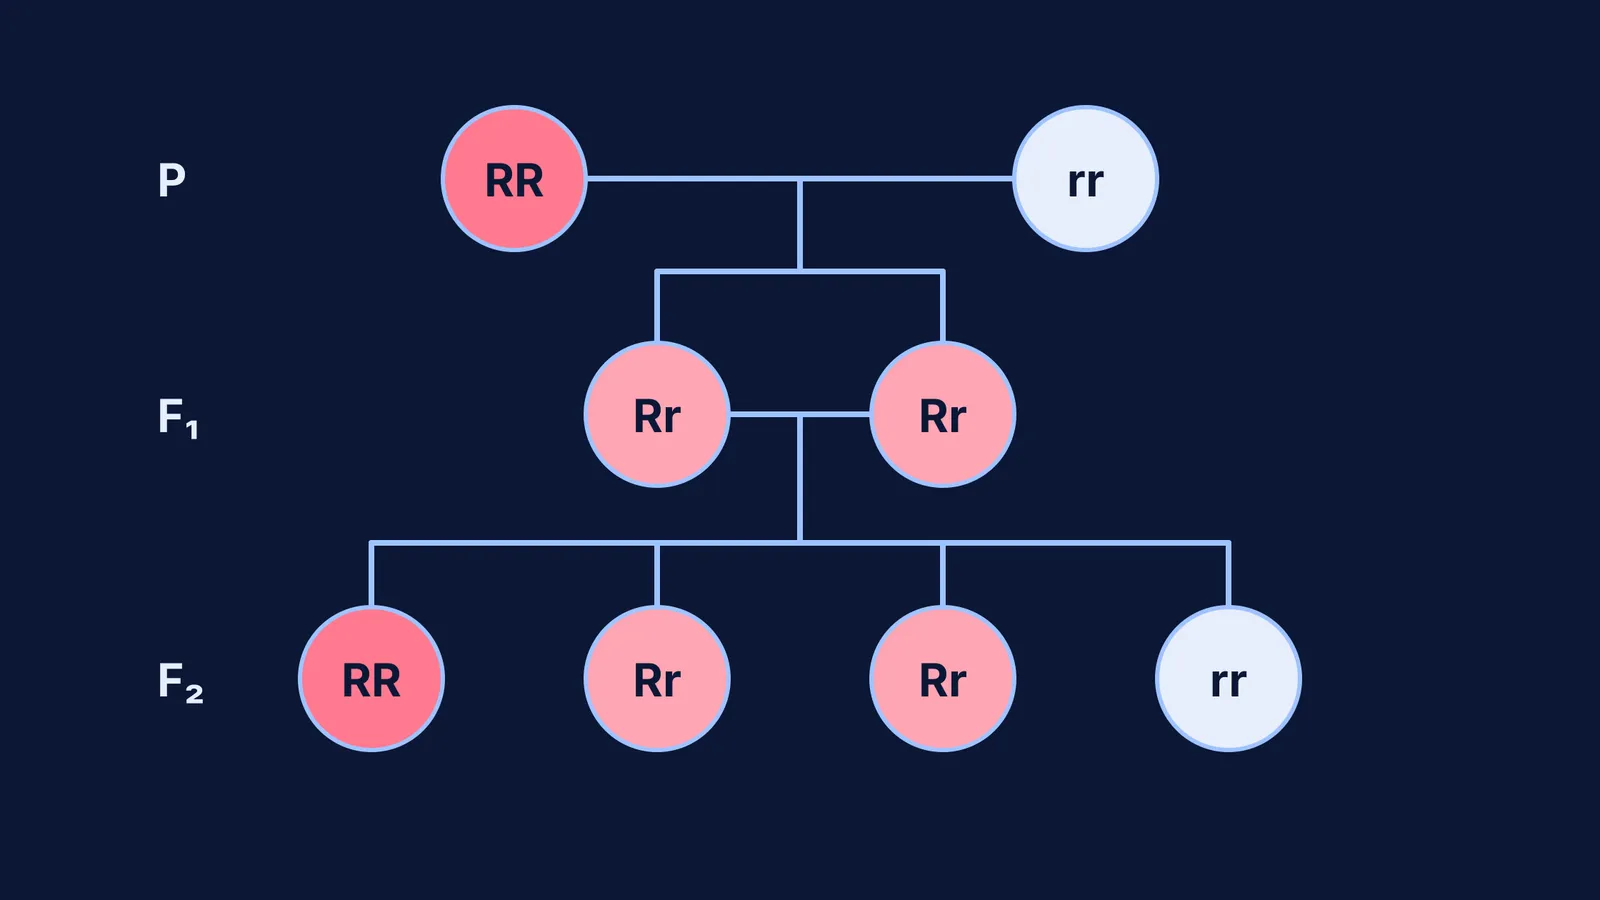
When a true-breeding red snapdragon (RR) is crossed with a true-breeding white snapdragon (rr), the parental generation passes one allele each to the offspring. As a result, every plant in the first filial (F1) generation will inherit the heterozygous genotype (Rr).
Because the red allele is not completely dominant over the white allele, the plant produces less red pigment than a homozygous red plant. The result is a lighter, intermediate colour: a pink flower.
How do you predict the F2 generation?
The fact that the genetic alleles do not permanently blend is proven when you cross two pink F1 snapdragons (Rr × Rr) to produce the F2 generation. If you were identifying an unknown genotype with a test cross, you would cross it with a homozygous recessive, but here we are crossing two heterozygotes. You can predict the outcome by setting up a simple Punnett square.
Worked Example: The F2 Punnett Square
Write the alleles of one pink parent (R and r) across the top of a 2×2 grid.
Write the alleles of the second pink parent (R and r) down the left side.
Fill in the boxes by combining the row and column alleles:
Top-left: RR (Red)
Top-right: Rr (Pink)
Bottom-left: Rr (Pink)
Bottom-right: rr (White)
Counting the squares reveals the exact proportions of the offspring. In incomplete dominance, the phenotypic and genotypic ratios are identical: 1:2:1 (Red : Pink : White) for the F2 generation (Wikipedia)). This means that statistically, 25% of the offspring will be red, 50% will be pink, and 25% will be white (Wikipedia)).
How does this compare to Mendel's complete dominance?
In Mendel's classic experiments with pea plants, traits like height exhibited complete dominance. When he crossed a tall plant (TT) with a short plant (tt), the F1 offspring were all tall (Tt). The dominant tall allele completely masked the recessive short allele.
When those F1 heterozygotes were self-pollinated, the hidden recessive trait reappeared. For complete dominance, the F2 phenotypic ratio is always 3:1 (three dominant phenotypes to one recessive phenotype) (Wikipedia)).
Snapdragons differ only in how the heterozygote looks. The underlying mechanism of alleles separating during reproduction remains exactly the same, which is why these principles also apply to human inheritance, including Mendelian disorders like sickle-cell anaemia.
If you want to practice predicting inheritance patterns beyond simple Mendelian genetics, working through these crosses visually helps. You can set up parent traits and watch the generations unfold in the Fermi Simulation Lab, which provides interactive simulations for the ideas that are easier to see than to read. Understanding how these variations modify the standard ratios is a key step in mastering genetics.


