
On this page
A p-n junction diode is where Class 12 semiconductor physics turns into a graph you have to sketch from memory: a curve that hugs zero and then shoots up on one side, and stays flat until a cliff on the other. A simulation lets you move the battery and watch the depletion layer and the ammeter change together, but only teaches you something if you predict first. This guide gives you the numbers to expect and five predictions to test, using the method from our guide to testing circuit misconceptions with a simulation.
What happens to the depletion layer in forward and reverse bias?
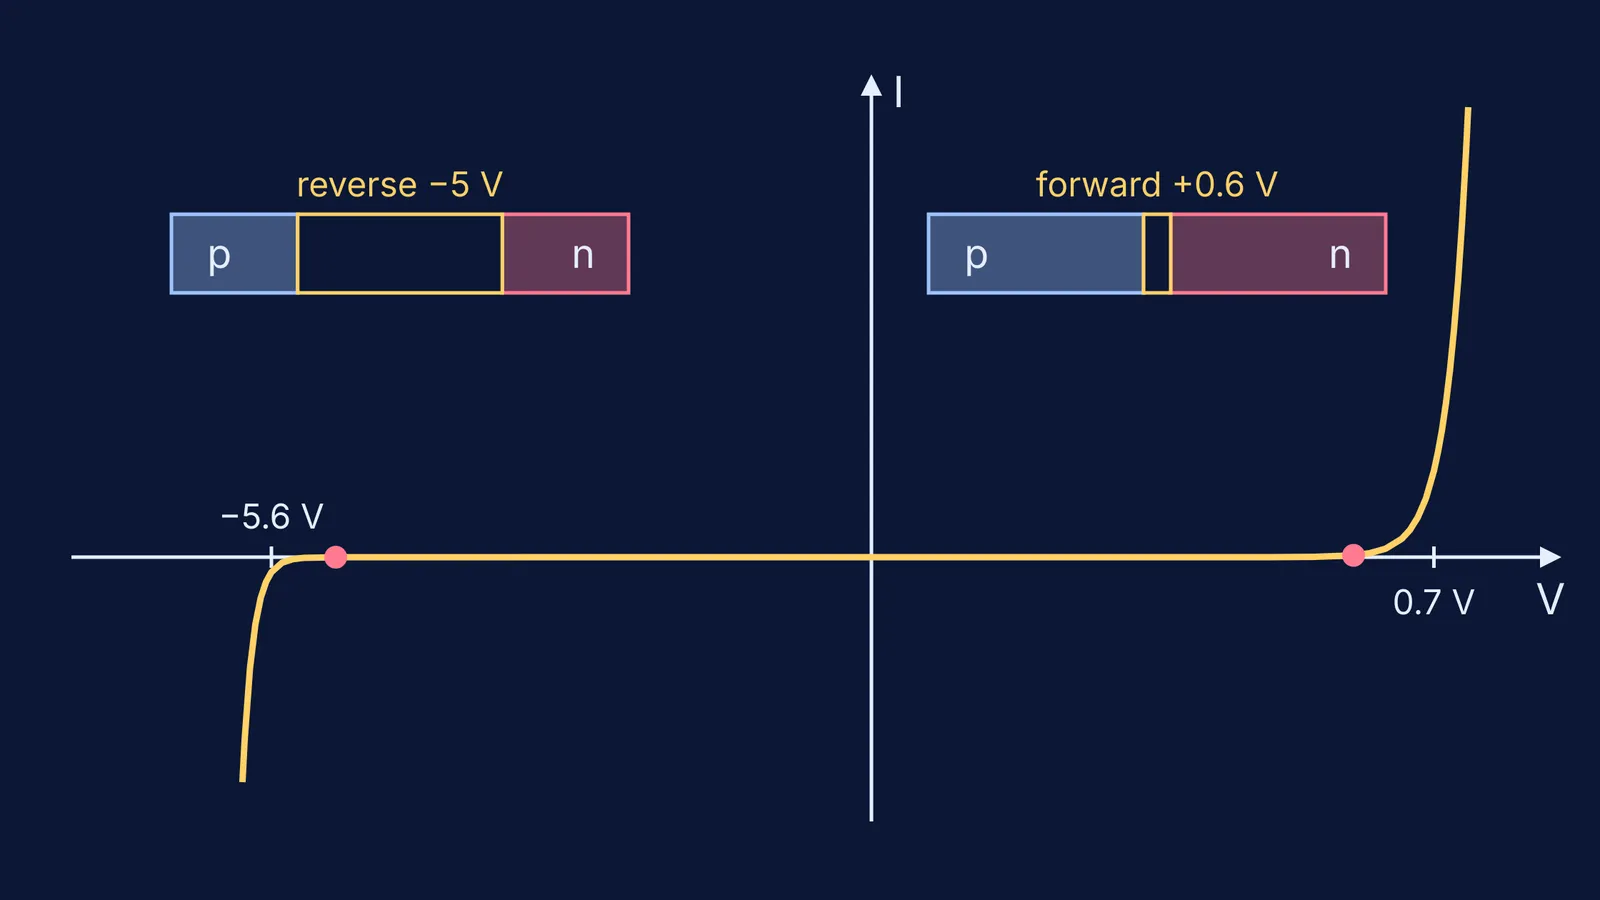
Even with no battery, electrons diffuse from the n-side into the p-side and fill holes, leaving a narrow double layer of fixed ions called the depletion layer, as the OpenStax University Physics text describes. The same source says that connecting the battery's positive terminal to the p-type side narrows the depletion layer (forward bias), and connecting it to the n-type side widens it (reverse bias).
How much it changes follows a square root. For an abrupt junction, the depletion width is W = √[2ε(N_A + N_D)(V_bi − V)/(eN_AN_D)], where V_bi is the built-in voltage and V is the applied voltage (TU Graz semiconductor notes). For a given diode, W is proportional to √(V_bi − V).
A worked example, taking V_bi = 0.7 V as a round value for a silicon junction:
No bias: √0.7 ≈ 0.84 units of width.
Reverse 5 V (V = −5 V): √5.7 ≈ 2.39, so the layer is about 2.9 times wider than at zero bias.
Forward 0.6 V: √0.1 ≈ 0.32, well under half the zero-bias width. Treat this forward value as a rough guide, since the formula is least reliable near V_bi.
Where does the current suddenly rise?
In forward bias, current follows the diode equation I = I₀(e^(eV/k_BT) − 1), and small changes in voltage lead to large changes in current (OpenStax). The quantity k_BT/e is about 0.0259 V at 300 K, using the Boltzmann constant of 8.617 × 10⁻⁵ eV/K from NIST.
That gives a rule you can check on screen: in the ideal equation, every extra 0.06 V of forward bias multiplies the current by about 10, because 0.0259 V × ln 10 ≈ 0.06 V. The current grows all along; it only seems to switch on because early values are invisible on a milliampere scale. For silicon diodes this visible rise, the threshold or cut-in voltage, is typically 0.6 to 0.7 V, and for germanium 0.25 to 0.3 V (Wikipedia's diode article).
In reverse bias, the current is approximately −I₀, a tiny current that barely changes as you raise the voltage (OpenStax). At an extreme reverse voltage, atoms in the material are ionised and an avalanche of current flows: this is the breakdown voltage. Zener diodes have a low breakdown voltage and are used in this region; one standard value is 5.6 V (Wikipedia's p-n junction article). Our Zener diode regulator guide shows how that cliff is put to use.
What does the I-V curve look like in each direction?
Forward (first quadrant): almost flat, then a steep rise near the cut-in voltage, with a narrow depletion layer.
Reverse (third quadrant): flat just below zero, then a near-vertical drop at breakdown, with a wide depletion layer.
Origin: no net current, but the depletion layer is already there.
For the exam version, with what each region means in questions, see reading forward and reverse bias curves.
Which predictions should you test in a p-n junction simulation?
One free option is PhET's Semiconductors simulation, a Java program that lets you create doped semiconductors and p-n junctions and explore their behaviour as the applied voltage changes (ComPADRE listing). Write each prediction down before you touch the slider; the numbers come from the sections above.
Zero bias. Predict: a depletion layer already exists and the ammeter reads zero. Why: diffusion built the layer, and at equilibrium the net current is zero.
Forward 0.3 V on silicon. Predict: a narrower layer, but current too small to see. Why: you are below the 0.6 to 0.7 V cut-in.
Forward 0.70 V, then 0.76 V. Predict: a clear current, then roughly ten times more. Why: about 0.06 V per factor of 10.
Reverse 5 V, then 10 V. Predict: the layer grows to about 2.9 and then 3.9 times its zero-bias width, while the current stays tiny and almost unchanged, as long as 10 V is below the diode's breakdown voltage. Why: the square-root rule, and reverse current of about −I₀.
Reverse past breakdown. Predict: a sudden large reverse current. Why: avalanche at the breakdown voltage.
If the screen disagrees with you, check which terminal is positive, the axis units, and whether the simulation models an ideal or a real diode.
If a moving picture helps you more than a frozen figure, the Fermi Simulation Lab has interactive simulations for ideas that are easier to see than to read. And if you are stuck on why the curve bends where it does, Fermi's AI tutor notices where you are stuck and decides whether to explain, ask or show.