

On this page
You open a photoelectric simulation, push the brightness slider to the top, and expect the electrons to fly out faster. They don't. More of them come out, but the fastest ones are no faster than before. That surprise is the heart of NCERT Class 12 Physics, Chapter 11 (Dual Nature of Radiation and Matter). Here are five predictions to write down before you touch a control, with numbers to check them against.
Why write predictions before you press play?
S. B. McKagan, W. Handley, K. K. Perkins and C. E. Wieman built a photoelectric-effect curriculum around an interactive computer simulation, interactive lectures and homework. In their 2009 paper in the American Journal of Physics, about 85% of students taught this way correctly predicted the results of changes to the experimental conditions. Most could state the observations and inferences, but were less successful at connecting the two logically. So for each prediction, write down the result and one sentence explaining why.
What happens when you change the intensity in a photoelectric simulation?
Prediction 1: brighter light gives more current. Fix the colour (say 400 nm, violet), make the collector plate positive, and raise the intensity from 25% to 50% to 100%. NCERT states that photocurrent increases linearly with intensity, because the number of photoelectrons emitted per second is proportional to the intensity (NCERT, section 11.4.1). Doubling the intensity should roughly double the current.
Prediction 2: brighter light does not change the stopping potential. Now make the collector negative and raise the reverse voltage until the current just reaches zero. That voltage is the stopping potential, V₀, and eV₀ equals the maximum kinetic energy of the electrons. Repeat at each brightness. NCERT says that for a given frequency, the stopping potential is independent of intensity. In Einstein's picture each electron absorbs one photon, so brightness changes how many photons arrive, not the energy of each one.
For the full argument, read why wave theory cannot explain the photoelectric effect, and for the curves themselves see photocurrent vs anode potential graphs for intensity and frequency.
Is there really a threshold frequency?
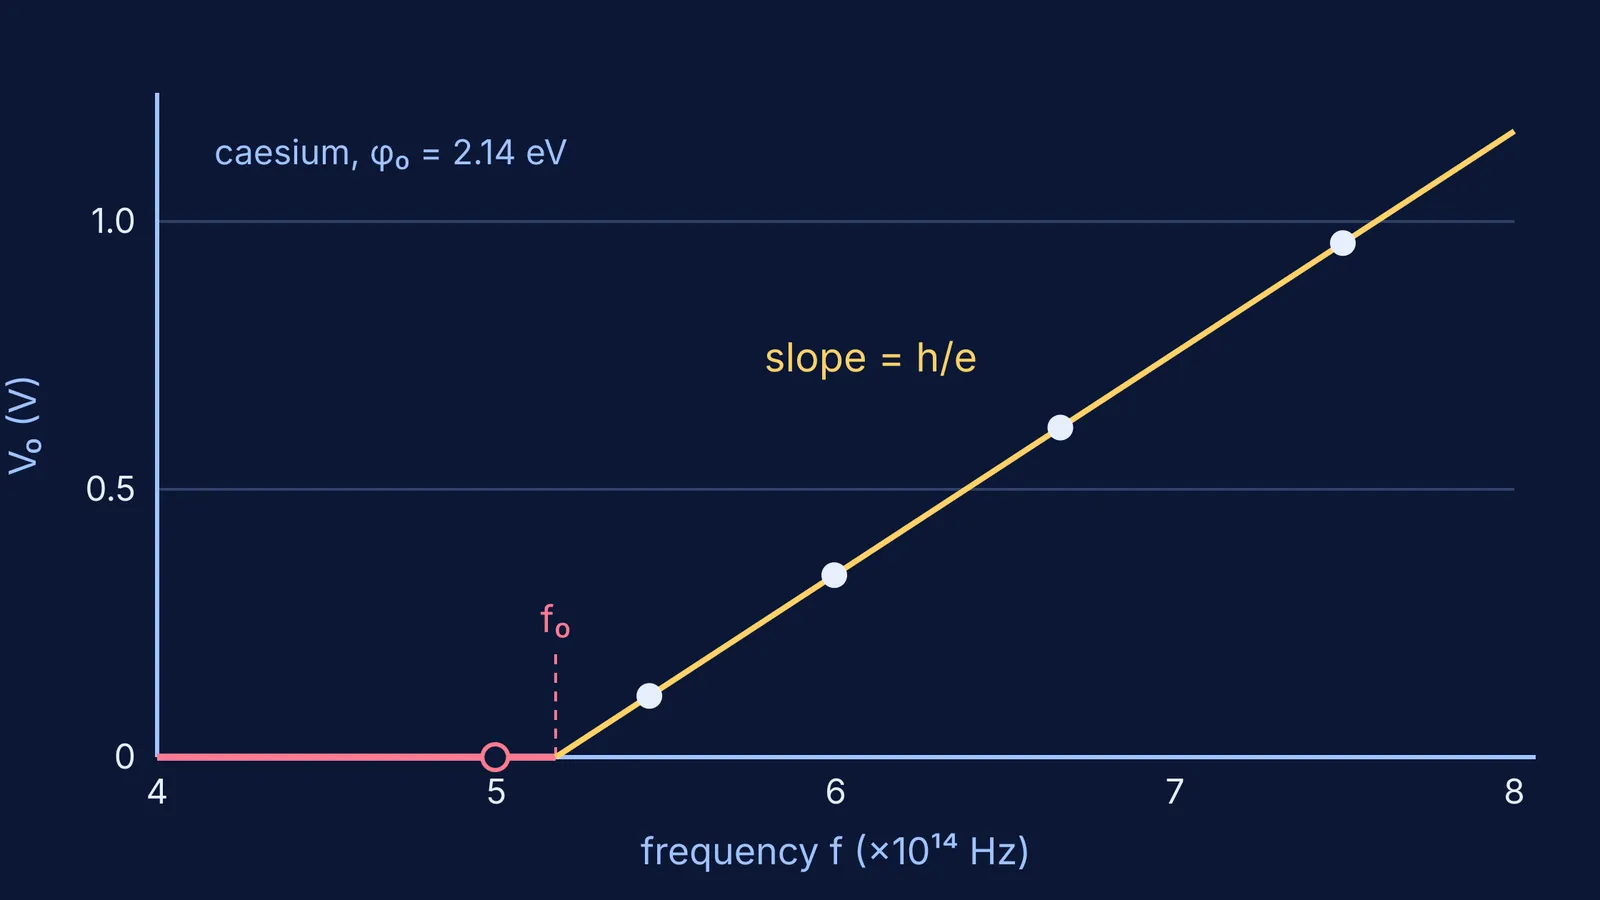
Prediction 3: below a certain frequency, no current at any brightness. The threshold frequency is f₀ = φ₀/h, where φ₀ is the metal's work function (NCERT, Eq. 11.3). NCERT's Example 11.2 gives caesium a work function of 2.14 eV. Planck's constant is 4.135667696 × 10⁻¹⁵ eV per hertz to ten significant figures (NIST), and the speed of light is exactly 299,792,458 m/s (NIST).
That puts caesium's threshold at about 5.17 × 10¹⁴ Hz, or about 579 nm, which is yellow light. So predict this: 600 nm orange light at full brightness gives zero current, and 550 nm green light gives a small current that you can stop with a small voltage.
Does stopping potential rise linearly with frequency?
Prediction 4: V₀ grows in a straight line with frequency. Einstein's equation, eV₀ = hf − φ₀, gives V₀ = (h/e)f − φ₀/e (NCERT, Eq. 11.4). For caesium, using the NIST values above:
600 nm (5.00 × 10¹⁴ Hz): photon energy 2.07 eV, below 2.14 eV, so no current
550 nm (5.45 × 10¹⁴ Hz): 2.25 eV, V₀ ≈ 0.11 V
500 nm (6.00 × 10¹⁴ Hz): 2.48 eV, V₀ ≈ 0.34 V
450 nm (6.66 × 10¹⁴ Hz): 2.76 eV, V₀ ≈ 0.62 V
400 nm (7.49 × 10¹⁴ Hz): 3.10 eV, V₀ ≈ 0.96 V
Now find the slope from two of these points: (0.96 − 0.34) V ÷ (1.49 × 10¹⁴ Hz) ≈ 4.2 × 10⁻¹⁵ V s. That matches h/e (4.14 × 10⁻¹⁵ V s) once you allow for rounding. NCERT notes that Robert Millikan measured this slope for sodium; he published the result as a direct photoelectric determination of Planck's h in Physical Review in 1916. We explain why the stopping potential vs frequency slope is h/e.
Prediction 5: a different metal moves the line but keeps the slope. A metal with a larger work function has a higher threshold, so its line starts further right, but NCERT notes the slope is independent of the material. If your simulation lets you choose the metal, plot two lines on the same axes and compare.
How do you run all five tests in one sitting?
Write the five predictions down, with a number wherever you can.
Choose one metal and one wavelength above threshold, then test intensity (predictions 1 and 2).
Keep the intensity fixed and step the wavelength from long to short. Note where current first appears (prediction 3).
Record V₀ at four wavelengths, plot it against frequency, and find the slope (prediction 4).
Switch metals and repeat two points (prediction 5).
If a result surprises you, write one sentence explaining it before you look anything up.
If you want somewhere to try this, the Fermi Simulation Lab has interactive simulations for ideas that are easier to see than to read, and Fermi's AI tutor can run the simulation with you and check your understanding as you go.


