

On this page
Most students memorise one sentence: "CO₂, acid and heat shift the curve right." It is true, but it hides the useful part: how much extra oxygen a right shift delivers, and where on the curve that happens. Here you will move the curve one variable at a time and put numbers on a working muscle versus your lungs.
What shifts the oxygen dissociation curve right or left?
The oxygen–haemoglobin dissociation curve plots how saturated haemoglobin is with oxygen (the y-axis) against the partial pressure of oxygen, PO₂ (the x-axis), as explained in a review by Collins and colleagues in the journal Breathe. Its key landmark is P50, the PO₂ at which haemoglobin is half saturated; the same review gives about 26 mmHg for normal adult blood.
According to that review, higher PCO₂, greater acidity (lower pH), higher temperature and more 2,3-DPG shift the curve to the right, and the opposite changes shift it to the left. A right shift means lower affinity: at any given PO₂, haemoglobin holds less oxygen and releases more.
How big is the pH effect? In John Severinghaus's equations for the human curve (Journal of Applied Physiology, 1979, DOI; linked PDF: his revised version), the Bohr effect is written as a change of −0.48 in log₁₀PO₂ per unit of pH at constant saturation. The same paper notes that when CO₂ is the acid, about 20% of the Bohr effect comes from CO₂ itself, separate from pH. For the history, read about Christian Bohr and the Bohr effect.
How much oxygen does active muscle unload compared with the lungs?
Here is a worked example you can repeat with any curve tool, or with a calculator. It uses Severinghaus's equations from the 1979 paper: his saturation formula, his table for the standard curve at pH 7.4 and 37 °C, his temperature coefficient and his Bohr factor. We assume haemoglobin of 15 g per 100 mL of blood and 1.34 mL of oxygen per gram (the factor in his content equation), ignoring dissolved oxygen, so full blood carries about 20.1 mL of oxygen per 100 mL. That matches the roughly 20 mL per 100 mL in the Breathe review.
Lungs: at a PO₂ of 100 mmHg the standard curve gives 97.5% saturation, about 19.6 mL of oxygen per 100 mL.
Resting tissue: at 40 mmHg the curve gives 74.7%, close to the typical 75% mixed venous saturation the Breathe review reports. The blood has unloaded 22.8 percentage points, about 4.6 mL per 100 mL.
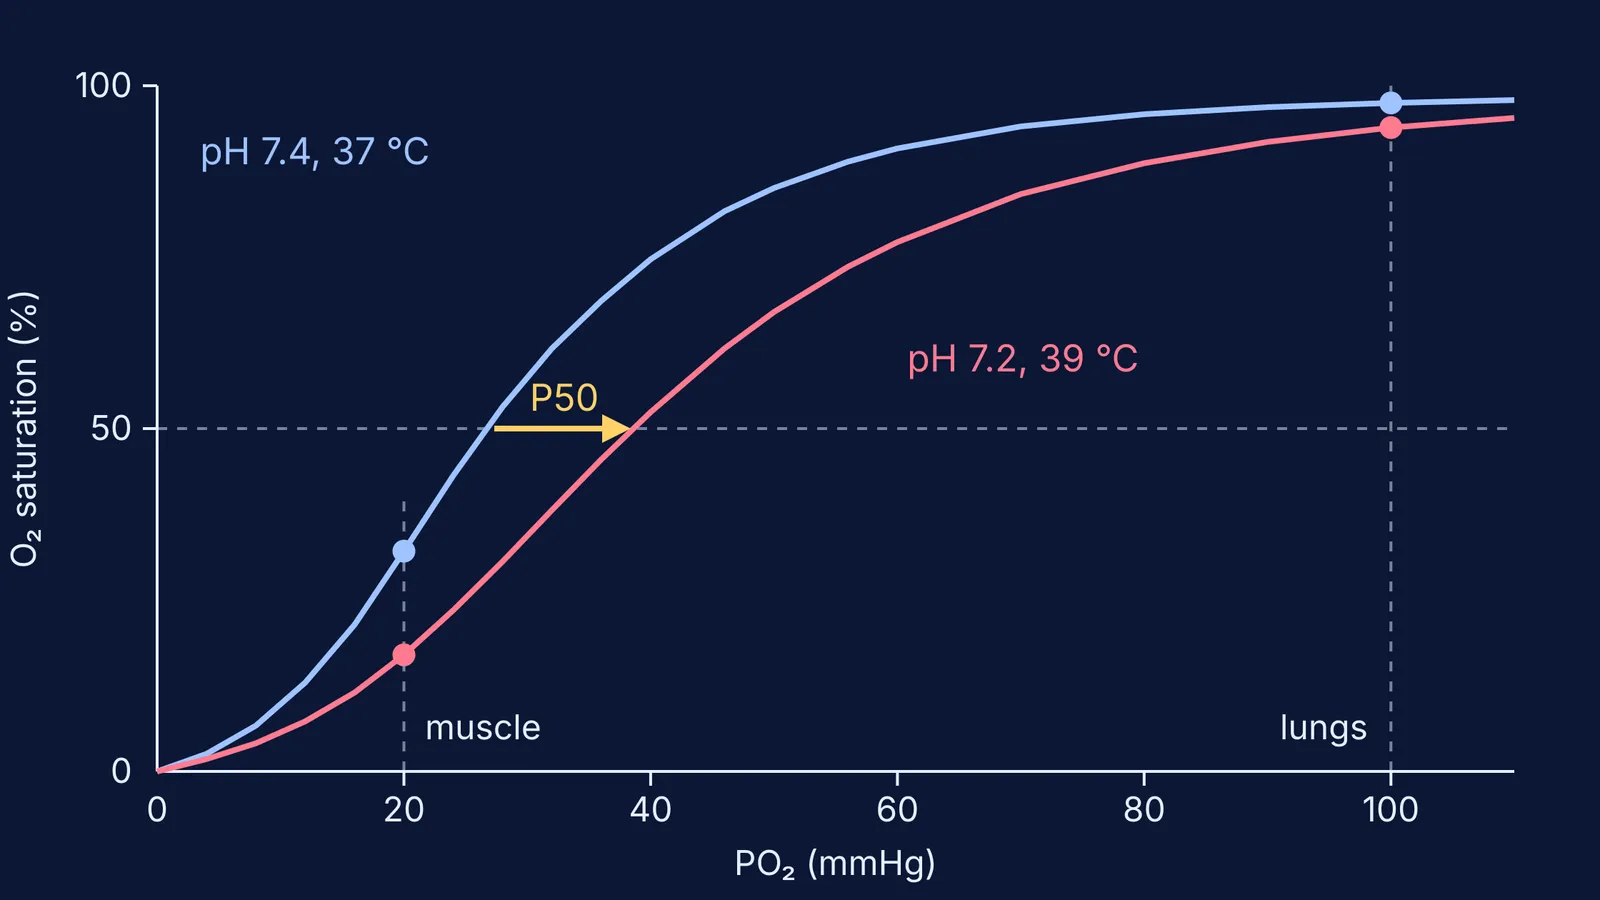
Hard-working muscle, curve not shifted: at 20 mmHg the standard curve gives 32.1%. Unloaded: 65.4 points, about 13.1 mL per 100 mL.
Same muscle, curve shifted: set pH to 7.2 and temperature to 39 °C. The 39 °C comes from Skattebo and colleagues in Acta Physiologica, who assumed femoral venous blood at 39.0 °C at maximal exercise; pH 7.2 is our illustrative choice. P50 moves from about 26.9 to about 38.6 mmHg, and saturation at 20 mmHg falls to about 17.0%. Unloaded: 80.5 points, about 16.2 mL per 100 mL.
Lung check: apply the same shift at 100 mmHg and saturation only drops from 97.5% to about 94%.
So the shift adds roughly 3 mL of oxygen per 100 mL of blood at the muscle, while costing the lungs much less. That asymmetry comes from the curve's S shape.
Does real muscle behave like this? The Skattebo meta-analysis found that, in the subjects with the highest maximal oxygen uptake, femoral venous PO₂ approached about 10 mmHg and saturation about 5% at maximal exercise, with leg oxygen extraction approaching 90–95%. At 10 mmHg the unshifted curve predicts 9.6%, while our shifted curve predicts about 5.6%, much closer to those values.
How do you practise curve shifts so they stick?
Predict before you look. Try this five-minute routine with any interactive curve, or explore the Fermi Simulation Lab, where ideas that are easier to see than to read are built as interactive simulations.
Before moving a slider, write down which way the curve will go and whether saturation at 20 mmHg will rise or fall.
Change one variable at a time: CO₂, then pH, then temperature.
Read the curve at two places every time, 100 mmHg and 20 mmHg, and note which one moved more.
Track P50 as a single number. Right shift means a bigger P50.
Say the result in one sentence: "Acid and heat lower affinity, so muscle gets more oxygen at the same PO₂."
Our guide to predicting first, then testing with a simulation explains why writing the guess down matters.
Two more traps are worth checking. First, judge a shift by the steep middle of the curve, not the flat top, where the curves almost overlap. Second, do not confuse haemoglobin with myoglobin, which has a different curve shape; see how haemoglobin and myoglobin compare.


