

On this page
In 1904, in Copenhagen, the physiologist Christian Bohr and his colleagues Karl Hasselbalch and August Krogh published an 11-page paper in Skandinavisches Archiv für Physiologie. Its German title translates roughly as "on a biologically important influence that the carbon dioxide tension of blood has on its oxygen binding" (Crossref record of the 1904 paper). That influence is now called the Bohr effect, and it is part of why your working leg muscles get more oxygen when you run up the stairs.
What is the Bohr effect?
The Bohr effect is the decrease in haemoglobin's oxygen affinity in the presence of low pH or high carbon dioxide (Deranged Physiology).
The chemistry happens in red blood cells. NCERT's Class 11 biology chapter on breathing says they hold a very high concentration of the enzyme carbonic anhydrase, which speeds up CO2 + H2O ⇌ H2CO3 ⇌ HCO3− + H+ in both directions (NCERT Biology Class 11, Chapter 14). So where carbon dioxide is high, hydrogen ions pile up too.
At low pH, histidine residues in haemoglobin pick up hydrogen ions and form salt bridges that hold the molecule in its deoxygenated "T" shape, which binds oxygen less tightly (Deranged Physiology). A 2015 review in Breathe notes that the effect of carbon dioxide is mediated largely by the accompanying change in acidity (Collins et al., 2015).
What did Bohr, Hasselbalch and Krogh find in 1904?
Working mostly with dog blood at different oxygen pressures, the team found that high carbon dioxide pressures shifted the curves to the right (Bohr effect, Wikipedia). Krogh invented the apparatus for measuring the gases and maintained all his life that he had been the first to demonstrate the effect (same source). You can read more about him in our story on August Krogh and how capillaries open when muscles work. Christian Bohr was also the father of the physicist Niels Bohr.
A 2004 review in Acta Physiologica Scandinavica says the 1904 discovery of the S-shaped oxygen curve and the Bohr effect stimulated continued research into the respiratory functions of blood and the shape changes inside haemoglobin (Jensen, 2004). For how that shape was worked out, read Max Perutz and the 22-year hunt for haemoglobin's shape.
How does the Bohr effect shift the oxygen dissociation curve?
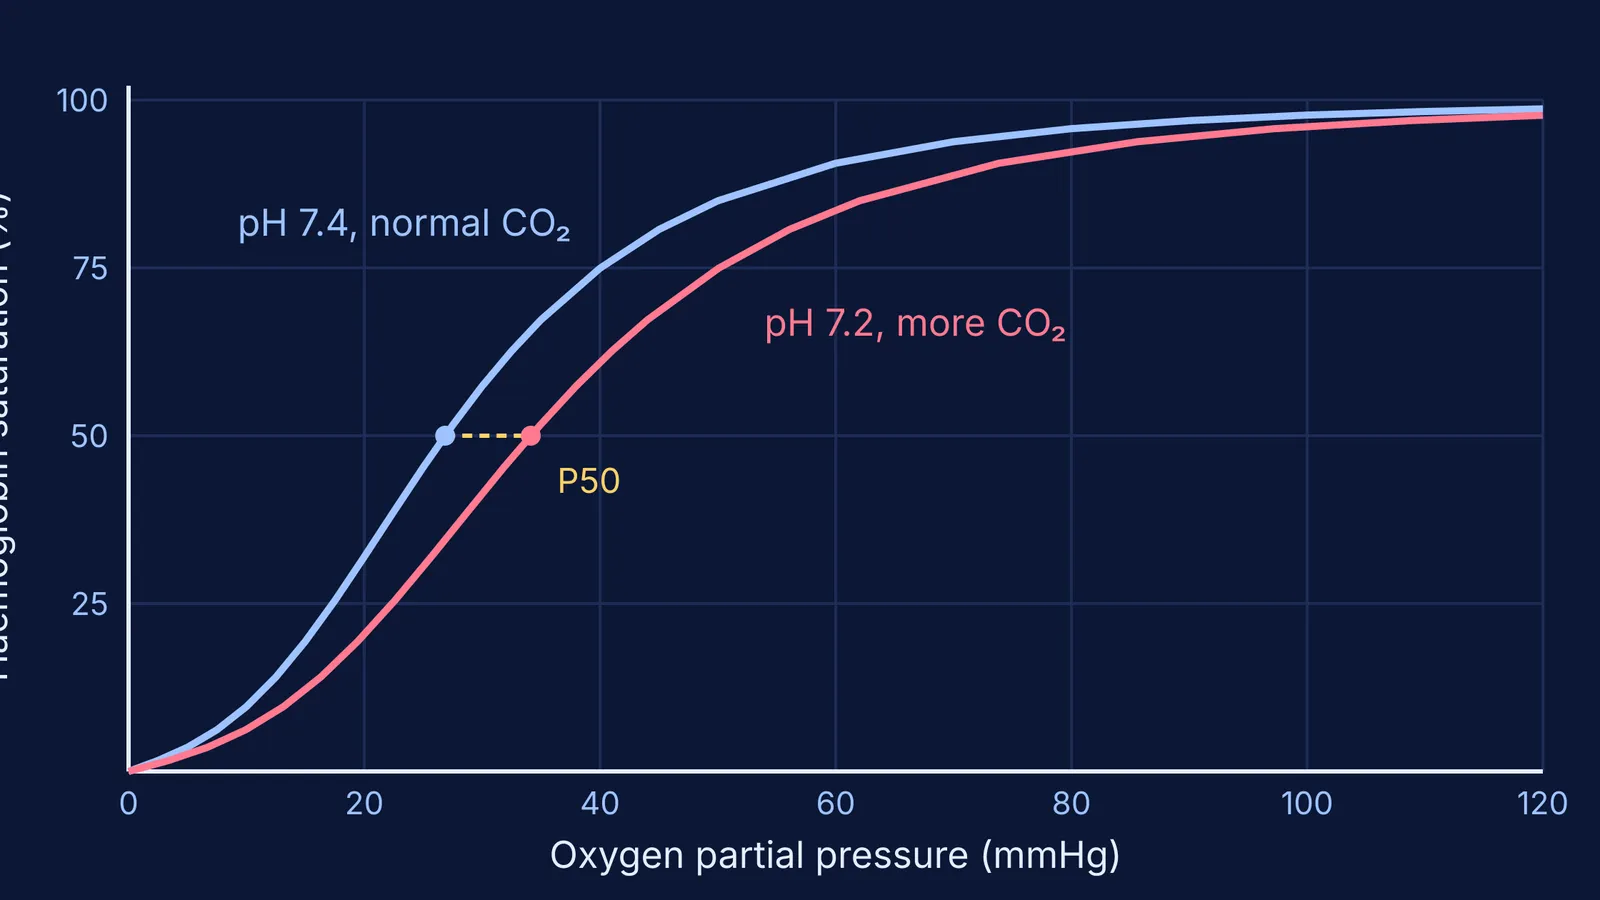
The dissociation curve plots haemoglobin saturation against the partial pressure of oxygen. A shift to the right means lower saturation at the same oxygen pressure, and it is caused by higher carbon dioxide, lower pH and higher temperature (Collins et al., 2015).
The handy marker is P50, the oxygen pressure at which haemoglobin is half saturated. The same review puts the P50 of normal adult blood at about 26 mmHg. In a 2022 study of blood from 30 volunteers, mean P50 at 37°C and a carbon dioxide pressure of 40 mmHg was 27.1 ± 2.6 mmHg (Woyke et al., 2022).
Worked example: how much more oxygen does a busy tissue get?
You can put numbers on this with John Severinghaus's 1979 equations, which fit the standard human curve closely and also give how the curve moves with pH (Severinghaus, 1979). NCERT's table gives an oxygen pressure of 95 mmHg in oxygenated blood and 40 mmHg in the tissues (NCERT Biology Class 11, Chapter 14).
Leaving the lungs at 95 mmHg and pH 7.4, haemoglobin is about 97.4% saturated.
In a resting tissue at 40 mmHg and pH 7.4, saturation falls to about 74.9%. Haemoglobin has released about 22.4 percentage points of its load. This matches the figure of about 75% saturation in mixed venous blood at rest given by Collins et al., 2015.
Now let the tissue work hard, so its blood becomes more acidic. If we take pH 7.2 as an illustration, Severinghaus's pH equation moves P50 from about 26.9 to about 34.1 mmHg, and saturation at 40 mmHg falls to about 61%.
Haemoglobin has now released about 36.4 percentage points, roughly 1.6 times as much oxygen at the same oxygen pressure.
The pH of 7.2 is a round number chosen to make the shift easy to see, not a measured value for any muscle.
How do you remember it for exams?
A revision checklist:
Draw the S-shaped curve: saturation up, oxygen pressure in mmHg across, P50 marked.
List the right-shift factors: more carbon dioxide, more hydrogen ions, higher temperature, more 2,3-DPG (Collins et al., 2015).
Tie them to places: lungs favour loading, tissues favour unloading.
Keep the pair straight: the Bohr effect is carbon dioxide and acid changing oxygen binding; the reverse, oxygen changing carbon dioxide and hydrogen-ion binding, is the Haldane effect (Jensen, 2004).
Keep carbon monoxide separate; see J. S. Haldane, carbon monoxide and the animals that warned miners.
The Fermi Simulation Lab has interactive simulations for ideas that are easier to see than to read. If pH or carbonic anhydrase is the shaky part, the Fermi Concept Library gives each biology and chemistry concept its own lesson.


