

On this page
When you find a median from an ogive, two numbers should agree: your formula answer and your graph reading. Here we build both ogives from one grouped table, predict where they meet, and show why a careful graph lands on the formula answer.
What is an ogive in statistics?
An ogive is a cumulative frequency curve; NCERT's Class 10 Statistics chapter calls them "cumulative frequency curves, called ogives" (NCERT Class 10 Mathematics, Chapter 13). A less-than cumulative frequency counts the observations below each upper class limit. A more-than cumulative frequency counts the observations at or above each lower class limit, as the chapter's Tables 13.13 and 13.14 show.
A syllabus note: the current NCERT reprint (2026-27) teaches the median formula but no longer has a section on drawing ogives, though its closing note still gives conditions for constructing one. Check your board's current syllabus.
Worked example: 53 students' marks
We use the chapter's own data (Table 13.12 in NCERT Chapter 13): marks out of 100 for 53 students.
0-10: 5, 10-20: 3, 20-30: 4, 30-40: 3, 40-50: 3
50-60: 4, 60-70: 7, 70-80: 9, 80-90: 7, 90-100: 8
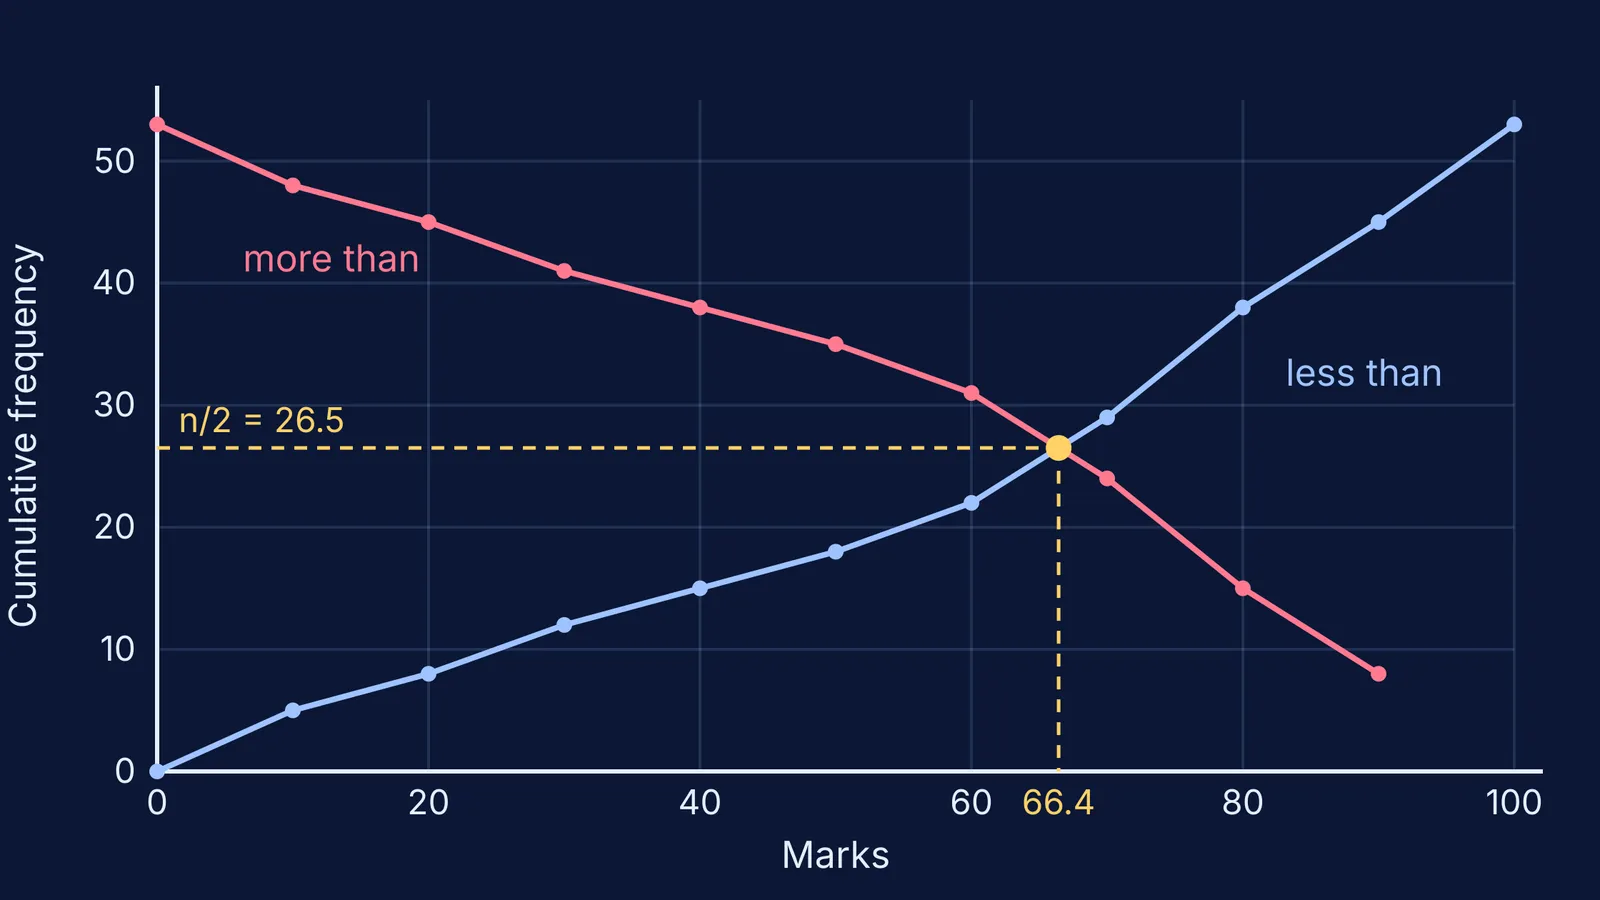
Less-than points (upper limit, cumulative frequency): (10, 5), (20, 8), (30, 12), (40, 15), (50, 18), (60, 22), (70, 29), (80, 38), (90, 45), (100, 53). Start the curve at (0, 0), since nobody scores below the first class.
More-than points (lower limit, cumulative frequency): (0, 53), (10, 48), (20, 45), (30, 41), (40, 38), (50, 35), (60, 31), (70, 24), (80, 15), (90, 8).
Now the formula. Here n = 53, so n/2 = 26.5. The median class is 60-70, the first class whose cumulative frequency (29) passes 26.5. With l = 60, cf = 22, f = 7 and h = 10, the textbook formula gives median = 60 + (26.5 − 22)/7 × 10 = 66.4.
Where will the less-than and more-than ogives cross?
Before you plot, write down two guesses: the height where the curves meet, and the class the crossing falls in.
Now test this reasoning. At any class boundary, every student is either below it or at or above it, so the two cumulative frequencies add up to n. At 60 marks: 22 + 31 = 53. Where the curves cross, the two values are equal, so each must be n/2 = 26.5. That is why the crossing point sits exactly halfway up, and its x-coordinate is the median.
Guessing first is not busywork. In a study of physics lecture demonstrations, Crouch, Fagen, Callan and Mazur found that students who only watched understood the concepts no better than students who did not see the demonstration at all, while students who predicted the outcome first showed significantly greater understanding (American Journal of Physics, 2004).
For ideas that are easier to see than to read, our Fermi Simulation Lab has interactive simulations.
How do you find the median from an ogive graph?
Draw both ogives on one sheet with the same axes. NCERT's note points out that the scale need not be the same on both axes (NCERT Chapter 13).
Mark n/2 on the y-axis (26.5 here).
Find where the curves cross. If you drew only a less-than ogive, draw a horizontal line from n/2 across to the curve instead.
Drop a vertical line from that point to the x-axis and read the value.
Compare it with your formula answer.
Joined with a ruler, the less-than segment from (60, 22) to (70, 29) reaches 26.5 at 60 + 4.5/7 × 10 = 66.4, exactly the formula's answer. The median formula is straight-line interpolation along the ogive. A freehand curve lands close to 66.4, not exactly on it; a gap of a mark or so is reading error, not a wrong method.
Why doesn't my ogive match my formula answer?
Check these before redoing the sum:
Points plotted at class marks (65) instead of upper limits (70) for the less-than ogive, or lower limits for the more-than ogive.
Gaps between classes, such as 118-126 and 127-135. The hint to Exercise 13.3 in NCERT Chapter 13 converts them to 117.5-126.5, 126.5-135.5 and so on before finding the median.
In the formula, cf taken as the cumulative frequency of the median class itself (29) instead of the class before it (22).
A running total that drifts. Your last less-than value must equal n.
Uneven tick spacing, which bends straight segments.
If a cumulative column keeps going wrong, our guide to asking AI to verify your cumulative frequency and class marks shows how to check each total. Then try it in reverse: finding a missing frequency when the median is given, or move on to the modal class and the mode formula.
If the formula step itself keeps tripping you up, the Fermi Problem Library has worked problems with a step-by-step solver that explains the reasoning rather than printing an answer.
Tonight, draw both ogives for Table 13.12, predict 26.5 before you look, and see whether your graph agrees with 66.4.


