

Statistics chapters on grouped data—such as finding the mean, median and mode—require a lot of arithmetic. It is tempting to upload a picture of a frequency distribution to an AI and ask for the final table. When you have a list of intervals like 0–10, 10–20, and 20–30, alongside their frequencies, the urge to skip the tedious addition and multiplication is strong.
However, doing this strips away the learning. A seminal 1989 study by Michelene Chi and colleagues on how students learn from worked examples showed the power of active engagement. The researchers observed students solving physics and maths problems and counted how often they paused to explain the steps to themselves. The study found that high-performing students generated 15.5 self-explanations per example and scored 82% on subsequent problem-solving tests, whereas low-performing students generated just 2.8 explanations and scored only 46% (Chi et al., 1989).
When you calculate the class marks (x) and cumulative frequencies (cf) manually, you are forced to self-explain. As you write out the numbers, your brain actively processes the data. You notice the pattern in the intervals, you spot when an answer feels too large, and you catch your own errors before they ruin your graph. In short, doing the arithmetic builds an intuitive feel for the data that reading an AI's output cannot match.
Why does cumulative frequency go wrong?
Examiner reports for school boards consistently point out the same recurring errors in statistics exams year after year. The most common mistake is plotting cumulative frequency against the midpoint of the class interval.
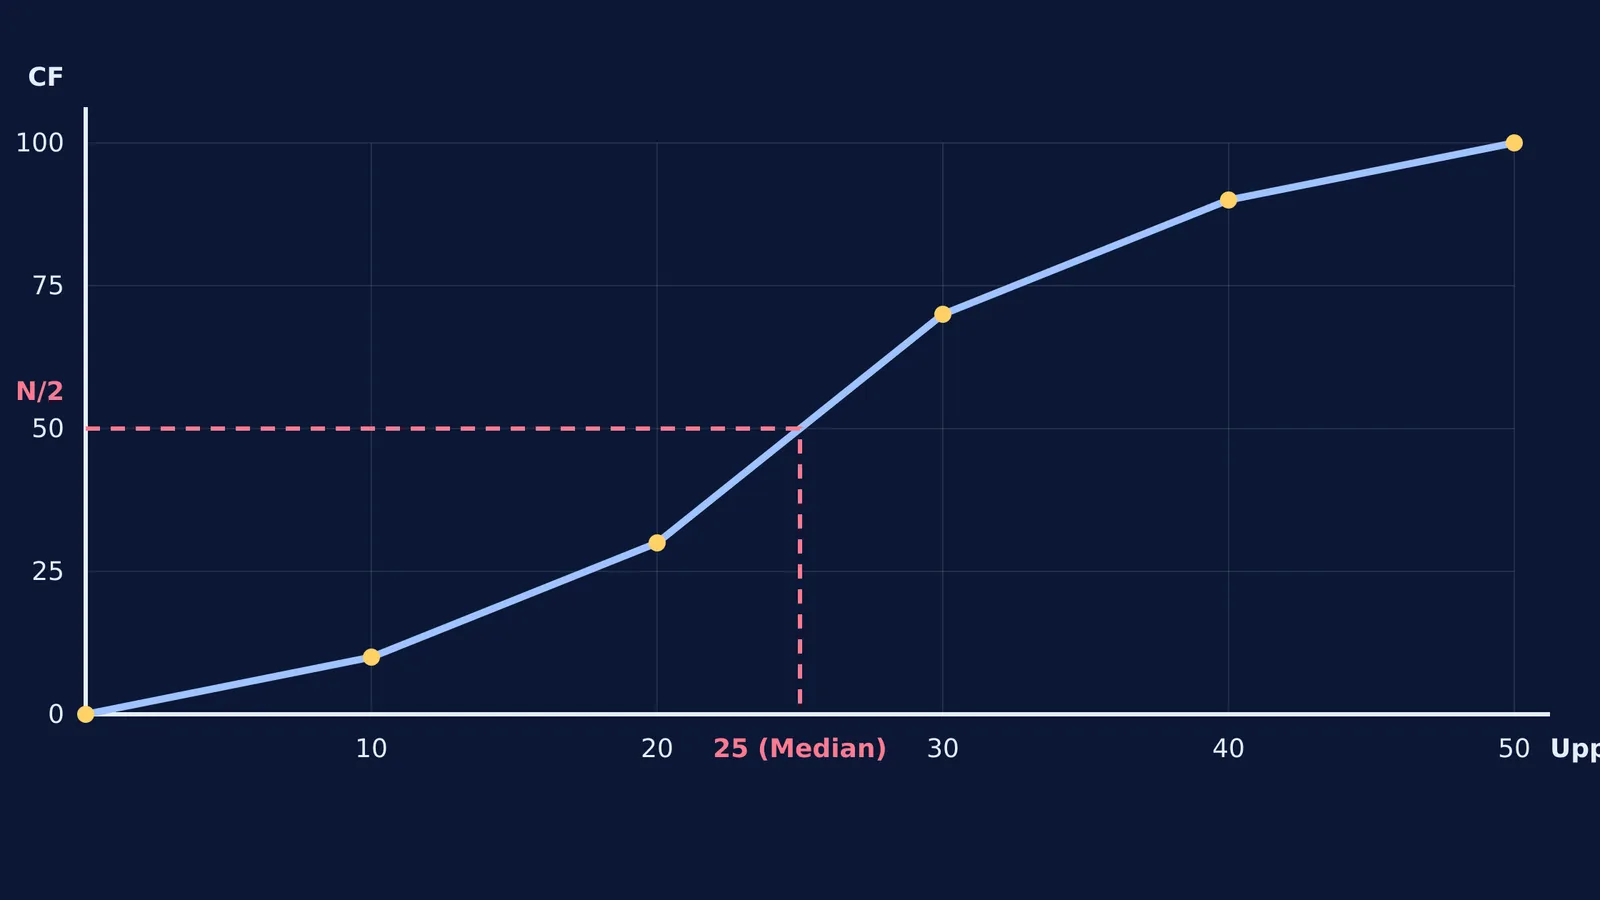
For a standard "less than" cumulative frequency curve (or ogive), you must always plot against the upper class boundary.
Why does this happen? Students often confuse the method for the mean with the method for the median.
The mean uses the class mark, which is the exact midpoint of the lower and upper limits. It represents an average value for that group.
The median and the cumulative frequency graph track a running total. Therefore, they must use the upper boundary, because the cumulative total represents all data points up to that absolute limit.
When you rely entirely on a machine to generate the table, these distinct concepts blur into a wall of numbers. By the time you sit down to draw the ogive, you might instinctively reach for the midpoints simply because you did not physically construct the running total yourself.
How should I ask AI to verify my working?
Instead of asking for the final answer, use Fermi's AI tutor to act as a sounding board. It can help you decide which method to use and check your logic, but you must leave the arithmetic to yourself.
Here is a step-by-step workflow to master statistics with an AI tutor:
Ask for the setup: Give the AI the raw data and ask a strategic question. For example, "Should I use the direct method, assumed mean, or step-deviation method here? Do not do the table for me." The tutor can point out that the step-deviation method is best when the class sizes are equal and the numbers are large, saving you time without doing the work for you.
Calculate the class marks yourself: Find the midpoint of each interval. You only need to calculate the first one and then add the class size sequentially to find the rest. This simple repetitive maths keeps you focused.
Verify the cumulative total: Build your cumulative frequency column by adding successive frequencies step by step.
Plot and verify: Draw the ogive yourself. Start at the lower boundary of the first class on the horizontal axis, and plot against the upper boundaries. Once you are done, ask the AI to verify your final reading of the median at N/2. If your curve is slightly off, the AI can help you troubleshoot whether the mistake was in plotting or in the arithmetic.
If you need a refresher on how the median reacts when you change the underlying data, check out our guide on how adding to or scaling data changes the mean and variance, or see a worked example of the mean absolute deviation about the median.
Using an AI to structure your approach while you crunch the numbers ensures you maintain the rigorous self-explanation habit that leads to mastery. It combines the best of both worlds: expert guidance to keep you on the right path, and active practice to build your mathematical intuition.


