On this page
Earth circles the Sun while the Moon circles Earth. So what does the Moon's own path around the Sun look like? Before you read further, draw your prediction on paper. Then test it with two numbers and one plot.
What shapes could the Moon's path around the Sun have?
Here are four shapes you might guess:
Loops, like a spring bent into a ring
Cusps, sharp points where the Moon stops for an instant
A wavy line that bends away from the Sun near new moon
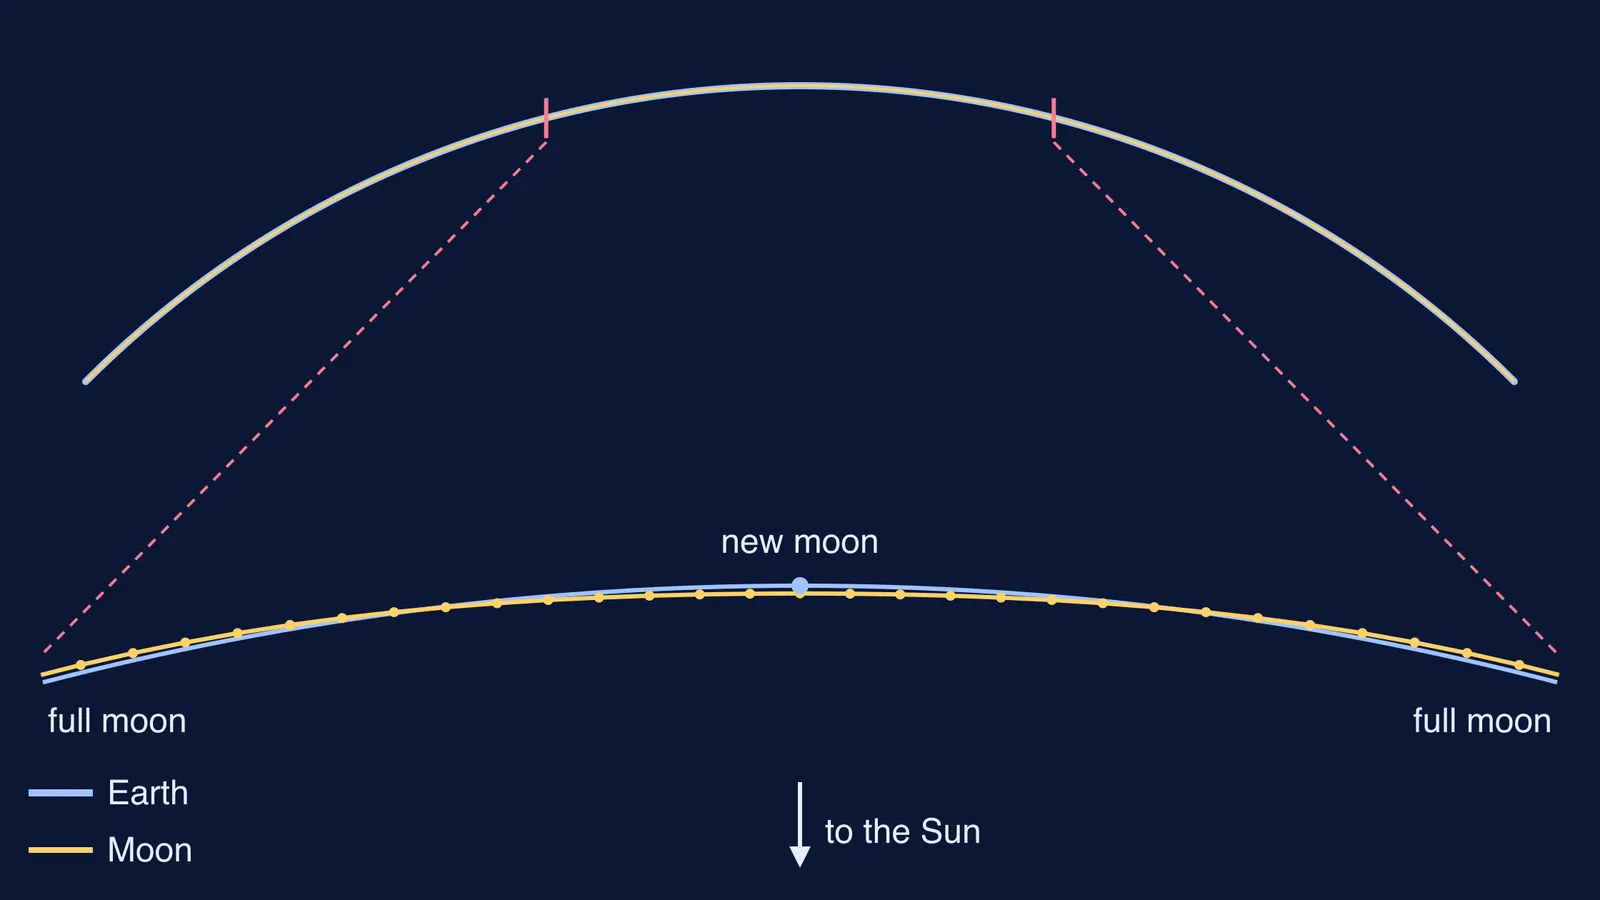
A smooth, almost circular curve that always bends towards the Sun
The checks below need only Class 11 mechanics.
Does the Moon ever move backwards around the Sun?
A loop needs the Moon to move backwards for a while.
Earth's mean orbital speed around the Sun is 29.78 km/s, according to NASA's Earth fact sheet. The Moon's mean orbital speed around Earth is 1.022 km/s, from NASA's Moon fact sheet.
The worst case is new moon. The Moon then sits between Earth and the Sun, and its motion around Earth points against Earth's motion. Its forward speed is still about 29.78 − 1.02 = 28.76 km/s. At full moon the two add to about 30.80 km/s. The forward speed never drops to zero, so there are no loops and no cusps. Earth moves about 29 times faster than the Moon circles it. The Wikipedia article on the Moon's orbit makes the same point: because the Moon's speed around Earth is not greater than its speed around the Sun, it does not go backwards and forwards in loops.
Does the Moon's path ever bend away from the Sun?
No loops still leaves the wavy option. A path bends towards the net force on the body, so the question is whether that force ever points away from the Sun. Worked example, with NASA's fact sheets for the Sun, Earth and Moon.
Sun's pull per kilogram on the Moon: GM of the Sun is 1.32712 × 10^11 km³/s², and the distance is about 149.6 million km, so g = GM/d² ≈ 5.9 × 10^-6 km/s², or 0.0059 m/s².
Earth's pull per kilogram on the Moon: GM of Earth is 3.986 × 10^5 km³/s², and the distance is 384,400 km, so g ≈ 2.7 × 10^-6 km/s², or 0.0027 m/s².
Ratio: 0.0059 / 0.0027 ≈ 2.2. The Sun pulls the Moon more than twice as hard as Earth does.
At new moon the two pulls point in opposite directions, and the net is still 0.0059 − 0.0027 = 0.0032 m/s² towards the Sun.
At every other point Earth's pull cancels less of the Sun's than that, so the net force always has a Sun-ward part. The path therefore curves towards the Sun everywhere. The Wikipedia article on the Moon's orbit says the same: seen from far outside, the Moon's trajectory is always convex and nowhere concave. For the link between force and curvature, see our guide to planetary orbits with a gravity simulation.
How do you plot the Moon's path yourself?
In a spreadsheet, use the 27.322-day sidereal month from the Wikipedia article on the Moon's orbit and the 365.256-day year from NASA's Earth fact sheet, treating both orbits as circles in one plane.
Column A: time t in days, from 0 to 365 in steps of 0.5.
Earth: X = 149600000 × cos(2πt/365.256) and Y = 149600000 × sin(2πt/365.256).
Moon: add 384400 × cos(2πt/27.322) to Earth's X and 384400 × sin(2πt/27.322) to Earth's Y.
Scatter-plot the Moon's X and Y with equal axis scales. You will see what looks like a plain circle.
Now plot only t = 0 to 30. Pick any three neighbouring points and check that the middle one lies on the far side of the line joining the other two, away from the Sun. It always will.
Break the model: predict first, then change 27.322 to 0.5 and plot t = 0 to 3 in steps of 0.01. The made-up moon now circles Earth at about 56 km/s, faster than Earth's 29.78 km/s, and loops appear.
Where does this show up in exams?
The same reasoning appears in questions on relative motion and centripetal acceleration. Practise with our worked calculation of Earth's orbital speed around the Sun, and see why the Earth-Moon pair actually orbits a point inside Earth in our post on the Earth-Moon centre of mass.
The Fermi Simulation Lab has interactive simulations for the ideas that are easier to see than to read. If you get stuck on why force sets the curve, Fermi's AI tutor can draw the figure, run the simulation and check your understanding as it goes.
Make your prediction, build the plot, then break it on purpose.