

On this page
Get 7 heads in 10 tosses and nobody blinks. Get 7,000 heads in 10,000 tosses and you would check the coin. That difference is the law of large numbers at work, and it is why probability seems to "only work" over many trials.
There is a twist: as you toss more, the percentage of heads gets closer to 50%, but the number of heads usually drifts further from exactly half. Here is why, using a real 10,000-toss experiment and a test you can run at home.
What does the law of large numbers actually say?
The law of large numbers says that "the average of the results obtained from a large number of independent random samples converges to the true value", in the words of the Wikipedia article on the law of large numbers. Jacob Bernoulli proved the first version, for two-outcome trials like a coin, in Ars Conjectandi, published in 1713.
So "the probability of heads is 1/2" describes the long run, not your next 10 tosses.
Predict first: how close will 10, 100 and 10,000 tosses get?
Before reading on, write down three guesses:
In 10 tosses, how many heads? How far from 5 would surprise you?
In 100 tosses, how far from 50 would surprise you?
In 10,000 tosses, how far from 5,000 would surprise you?
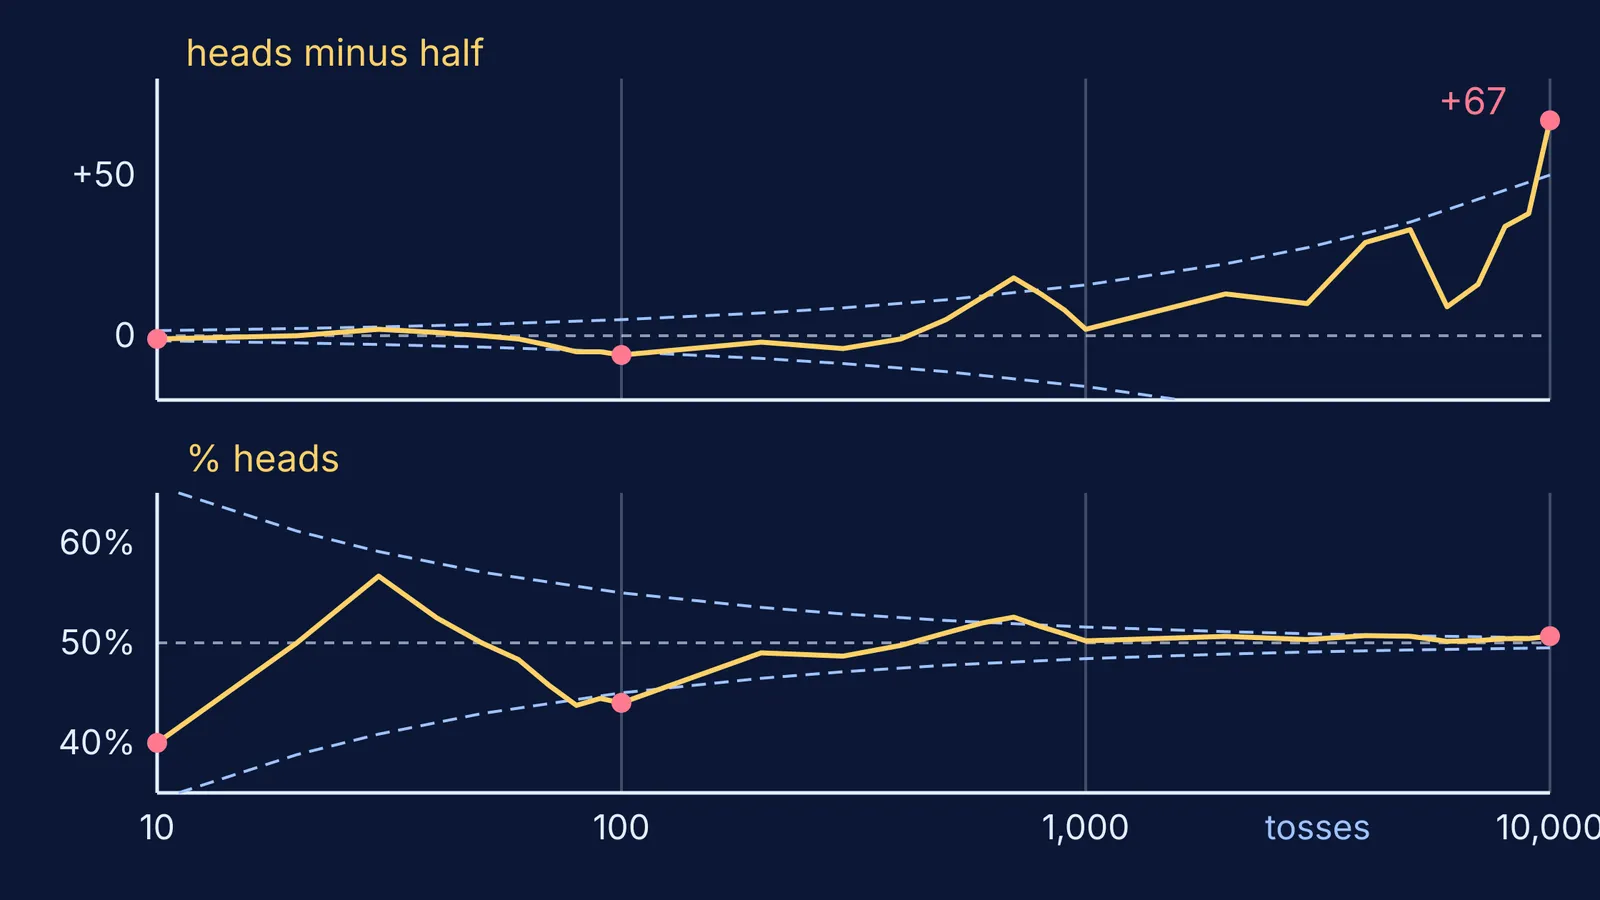
While interned during the Second World War, the mathematician John Kerrich tossed a coin 10,000 times and got 5,067 heads, as these University of Oslo lecture notes reproducing his data show. He published the results in 1946.
After 10 tosses: 4 heads, which is 40% heads and 1 head below half.
After 100 tosses: 44 heads, which is 44% heads and 6 below half.
After 10,000 tosses: 5,067 heads, which is 50.67% heads and 67 above half.
The percentage moved towards 50%. The gap in heads grew from 1 to 67.
Why does the gap in heads grow while the percentage settles?
The Oslo notes on Kerrich's data put it in one line: the chance error "increases with the number of tosses in absolute terms, but it decreases in relative terms". The Wikipedia article agrees: the proportion of heads approaches 1/2, yet the absolute difference between heads and tails almost surely becomes large.
The reason is how spread scales. For n trials with success chance p and failure chance q, the standard deviation of the count is the square root of npq, as the OpenStax Introductory Statistics chapter on the binomial distribution sets out. For a fair coin, p = q = 1/2, so the typical gap from half is the square root of n, divided by 2:
10 tosses: typical gap about 1.6 heads, which is about 16 percentage points.
100 tosses: typical gap 5 heads, which is 5 percentage points.
10,000 tosses: typical gap 50 heads, which is 0.5 percentage points.
The gap grows like the square root of n, but the tosses grow like n itself, so the percentage error keeps shrinking. To cut the typical percentage error by 10 times, you need 100 times as many tosses. Kerrich's gap of 67, a little over the typical 50, is ordinary luck.
If a tail still feels "due" after a run of heads, see our post on coin streaks and the gambler's fallacy.
Why does probability only work over many trials?
It works for 10 trials too; it just predicts a wide spread, not an exact count. By binomial counting, in 10 tosses there are 2 to the power 10, or 1,024, equally likely sequences, and 252 of them have exactly 5 heads (that is 10C5). So exactly half happens only about 1 time in 4.
A cricket captain who wins 7 of 10 tosses is not lucky in any lasting way. Small samples are not wrong; they are noisy, and more trials shrink the noise in the percentage.
Try it yourself: a 20-minute coin experiment
This works alone or with a parent.
Write your three predictions from above.
Toss a real coin 10 times. Pool results with family or classmates to reach 100.
Run 10,000 tosses in a simulation or a spreadsheet random-number function.
For each run, record tosses, heads, heads minus half, and percentage of heads.
Compare each gap with the square root of the tosses, divided by 2.
Explain in one sentence why the gap and the percentage moved differently.
Our post on predicting first, then testing with a simulation explains why the prediction step matters. The Fermi Simulation Lab has interactive simulations for the ideas that are easier to see than to read. If the square-root step is where you get stuck, Fermi's AI tutor notices where a student is stuck and decides whether to explain, ask or show.
Next, see what happens when you add up many random results in our central limit theorem dice simulation.


