On this page
When you learn about inverse functions in algebra, the standard method is algebraic: swap the variables x and y, and then solve for y. While this recipe produces the right formula for simple cases, treating inverses merely as algebraic manipulation hides the geometry that explains why the method works.
Research shows that treating inverse functions purely through symbol manipulation leaves persistent conceptual gaps. In a 2019 study published in the EURASIA Journal of Mathematics, Science and Technology Education, Kin Eng Chin and Robyn Pierce found that more than 50% of student errors on inverse notation arose from confusing the functional superscript in f⁻¹(x) with an arithmetic reciprocal, 1/f(x). Similarly, research on the Precalculus Concept Assessment by Marilyn Carlson and colleagues revealed that only about 35% of college students completing precalculus could find an input from an output by reading a graph in reverse.
To see why inverting a function is not the same as dividing by it, we have to look at the coordinate plane.
Why do we reflect an inverse function across y = x?
A function turns an input into an output. Its inverse reverses that process, returning the original input. If a function f maps an input of 2 to an output of 5, the inverse function f⁻¹ maps 5 back to 2.
On a Cartesian graph, this means every point (x, y) on the original curve becomes (y, x) on the inverse curve.
When you swap the coordinates of a point, you reflect it across the diagonal line where the x-coordinate equals the y-coordinate. That line is y = x. If you plot a curve on paper and fold the sheet diagonally along y = x, the imprint on the other side traces the inverse function. The line segment connecting (x, y) to (y, x) is perpendicular to y = x, and its midpoint lies on y = x.
How do you find the inverse of eˣ graphically?
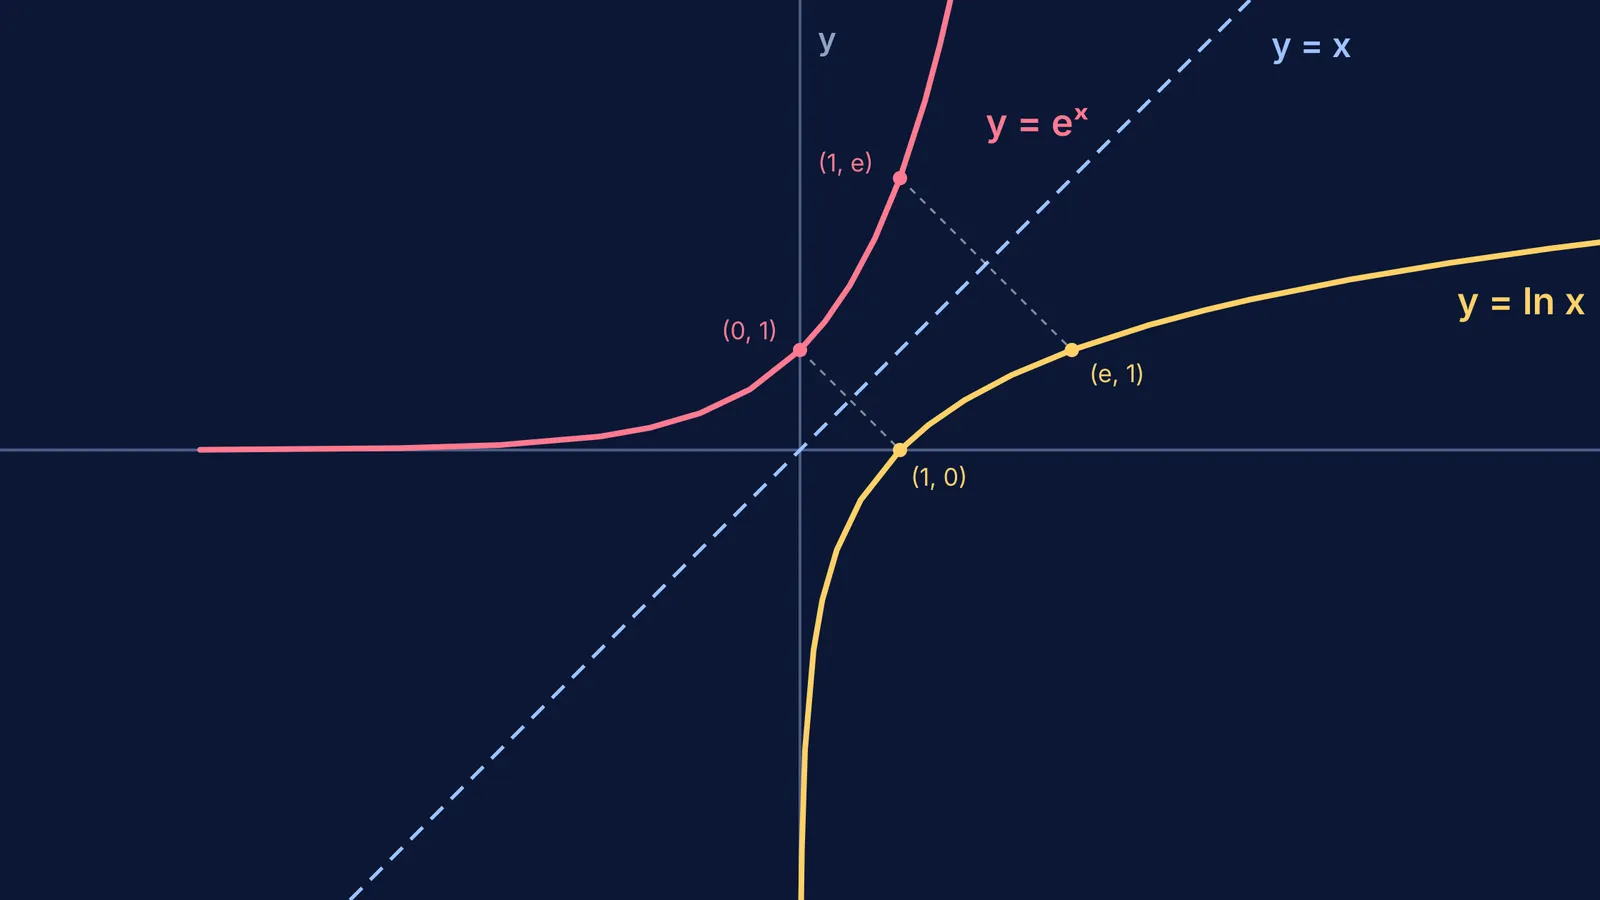
Take the exponential function, y = eˣ. The curve stays above the horizontal axis, passes through (0, 1), and climbs rapidly to the right.
To find its inverse curve without algebra, reflect it across y = x:
The point (0, 1) reflects across y = x to become (1, 0).
The tail hugging the negative x-axis reflects into a tail hugging the negative y-axis.
The steep upward growth in the first quadrant reflects into a curve that opens outward to the right.
The reflected curve is the natural logarithm, y = ln x. If you are struggling to picture this reflection in your head, the Fermi Simulation Lab provides interactive simulations for ideas that are easier to see than to read, letting you plot curves and watch their reflections update in real time.
Why do some functions need a restricted domain?
For a curve to be a function, it must pass the vertical line test: each x can have only one y.
Consider the parabola y = x². If you reflect this U-shape across the line y = x, it becomes a horizontal parabola opening to the right. This curve fails the vertical line test. An input of x = 4 yields two outputs: y = 2 and y = -2. Because a function cannot map one input to two outputs, y = x² has no inverse across its full domain. It failed the horizontal line test before the reflection occurred.
To find an inverse for y = x², we restrict its domain to x ≥ 0, throwing away the left half of the parabola. Reflecting the remaining right half across y = x gives the square root function, y = √x.
This geometric principle explains why trigonometric functions require restricted branches. When finding the domain of composite inverse trigonometric functions, restricting the domain of the original wave ensures its reflection remains single-valued.
How does reflection connect to derivatives?
Reflecting across y = x also provides an intuitive bridge to calculus. Because the reflection swaps horizontal and vertical axes, it inverts the slopes of tangent lines. If the tangent to y = f(x) at (a, b) has slope m, the reflected tangent to y = f⁻¹(x) at (b, a) has slope 1/m. This geometric relationship leads directly to the formula for the derivative of an inverse function: (f⁻¹)′(b) = 1 / f′(a).
Visualising the flip across y = x makes it easy to understand where inverses come from and why f⁻¹(x) is not a reciprocal. For more ways to visualise functions on a grid, explore our guide to graph transformations with shifts and reflections.