
On this page
The graph of g against distance from Earth's centre turns up in Class 11 gravitation and in JEE. Most students learn it as two formulas. It is easier to remember as one shape, built in three steps: a uniform Earth, the space above it, and the real Earth.
How does gravity change inside Earth if density is uniform?
Inside a sphere, only the mass closer to the centre than you pulls on you overall; the shell outside you cancels itself out. OpenStax University Physics states it directly: only the mass within r contributes, and for constant density g = (4/3)πGρr.
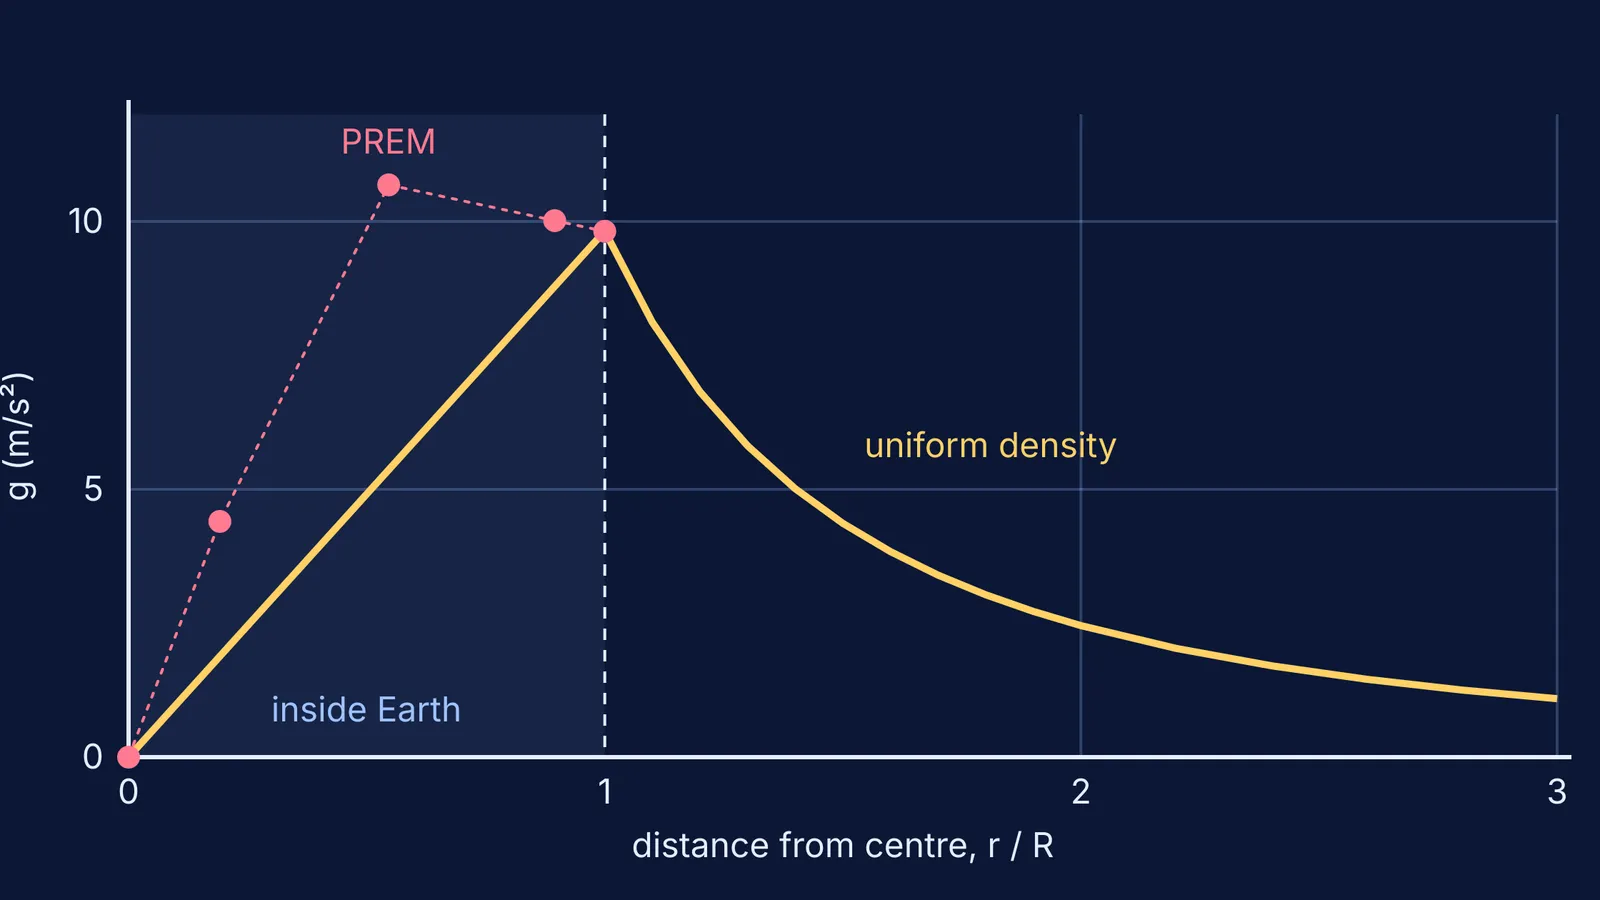
So g is proportional to r. Inside a uniform Earth, g = g_s × (r/R), where g_s is surface gravity and R is Earth's radius. NASA's Earth fact sheet gives a mean surface gravity of 9.820 m/s² and a mean radius of 6,371 km. At the centre, g is zero because the pulls from every direction balance.
What happens to g above Earth's surface?
Once you are outside, all of Earth's mass is below you, and it acts as if it sat at the centre. Then g = GM/r², or g = g_s × (R/r)². Using NASA's mean surface gravity of 9.820 m/s²:
At r = R (the surface): 9.82 m/s²
At r = 1.1R (about 637 km up): 9.82 ÷ 1.21 = 8.12 m/s²
At r = 2R (one Earth radius up): 9.82 ÷ 4 = 2.46 m/s²
At r = 3R: 9.82 ÷ 9 = 1.09 m/s²
Together you get a straight ramp up to a sharp corner at the surface, then a curve that falls quickly and never reaches zero. There is no jump at r = R, because both formulas give g_s there. Our guide to reading physics graphs covers that kind of check.
Is gravity strongest at Earth's surface?
For a uniform Earth, yes. For the real Earth, no. The standard reference model of Earth's interior is the Preliminary Reference Earth Model (PREM), published by Adam Dziewonski and Don Anderson in 1981 in Physics of the Earth and Planetary Interiors90046-7). Its gravity values, as listed in the ASPECT geodynamics code documentation, are:
4.40 m/s² at the boundary of the solid inner core
10.68 m/s² at the core-mantle boundary, roughly 3,485 km from the centre by NASA's figure for the core radius
10.01 m/s² at the boundary between the upper and lower mantle
9.82 m/s² at the surface
In these PREM values, g is higher at both mantle boundaries than at the surface, and the largest value is at the top of the core: 10.68 m/s², about 9% above the surface value.
Why does density change the shape of the graph?
The general rule is g(r) = GM(r)/r², where M(r) is the mass inside radius r. Differentiate it and you get dg/dr = 4πGρ − 2g/r. In words: going down, g increases wherever the local rock is less dense than two-thirds of the average density of everything below it. The mantle is light compared with the dense core beneath it, so g holds up or rises as you descend. In a uniform Earth the local density equals the average, above the two-thirds line, so g falls in a straight line to the centre.
Worked example: a shaft down to the core
Using NASA's radii, the core-mantle boundary is about 6,371 − 3,485 = 2,886 km deep.
Uniform model: g = 9.82 × (3,485 ÷ 6,371) = 9.82 × 0.547 ≈ 5.37 m/s².
PREM: 10.68 m/s².
Verdict: the uniform model is off by about a factor of two at that depth.
Now a variable-density problem of the JEE Advanced kind. Take ρ(r) = ρ₀(1 − r/R).
Mass inside r: M(r) = 4πρ₀(r³/3 − r⁴/(4R)).
Field: g(r) = GM(r)/r² = 4πGρ₀(r/3 − r²/(4R)).
Maximum: set dg/dr = 0, so 1/3 − r/(2R) = 0, giving r = 2R/3.
When density falls off towards the surface, the peak moves inside the planet, just as PREM shows.
A checklist for any g-versus-r question
Mark the regions: inside the body, outside it, and any cavity or shell.
Inside and uniform: g ∝ r. Outside: g ∝ 1/r².
Density given as a function: integrate 4πr²ρ to get M(r), then divide GM(r) by r².
Check that g is zero at the centre, continuous at the surface and close to zero far away.
Look for the peak: at the surface for a uniform sphere, inside the body if the density near the surface is less than two-thirds of the average density.
Hollow shells and spheres with a cavity follow the same rules; we work through them in gravity inside a hollow shell and a sphere with a cavity. The outside curve is also the starting point for orbital speed, energy and escape speed problems.
The Fermi Simulation Lab has interactive simulations for ideas that are easier to see than to read. If the M(r) integral is where you get stuck, the Fermi Problem Library has worked problems with a step-by-step solver that explains the reasoning rather than printing an answer.