
On this page
Here is a question that looks easy and quietly trips people up. A bag holds 3 red balls and 7 blue ones. You draw until you see red. On average, how many draws does that take? The answer depends on whether you put each ball back. Before you read on, write down a guess for both cases. You'll test it at the end.
What is the expected number of draws until the first red?
With replacement, every draw is a fresh start with the same chance p of red. The number of draws needed to get the first success follows a geometric distribution, and its mean is 1/p. The same page gives a familiar check: if you roll a die until you get a 1, you need 6 rolls on average.
Without replacement, the bag changes as you draw. For N items of which R are red, the expected number of draws up to and including the first red is (N+1)/(R+1). Nils Lid Hjort gives this formula for cards and aces in an arXiv paper on how many cards it takes to reach the first ace, and it follows from the negative hypergeometric distribution.
Why are fewer draws needed without replacement?
Every blue ball you remove makes red more likely next time. With 3 red balls in a bag of 10, the chance of red goes 3/10, then 3/9, then 3/8 as the blues come out, the setup behind the negative hypergeometric distribution. With replacement it stays at 3/10 forever, so a long unlucky run is possible.
There is also a neat symmetry argument, used in this ProofWiki proof for the first ace. Pick any one blue ball. Look only at it and the 3 reds. All orders of these 4 balls are equally likely, so the blue comes before every red with probability 1/4. There are 7 blue balls, so on average 7/4 = 1.75 blues come out before the first red. Add the red itself and you get 2.75.
Worked example: 3 red and 7 blue balls
Using the two formulas above (1/p from the geometric distribution, and (N+1)/(R+1) from the Hjort paper):
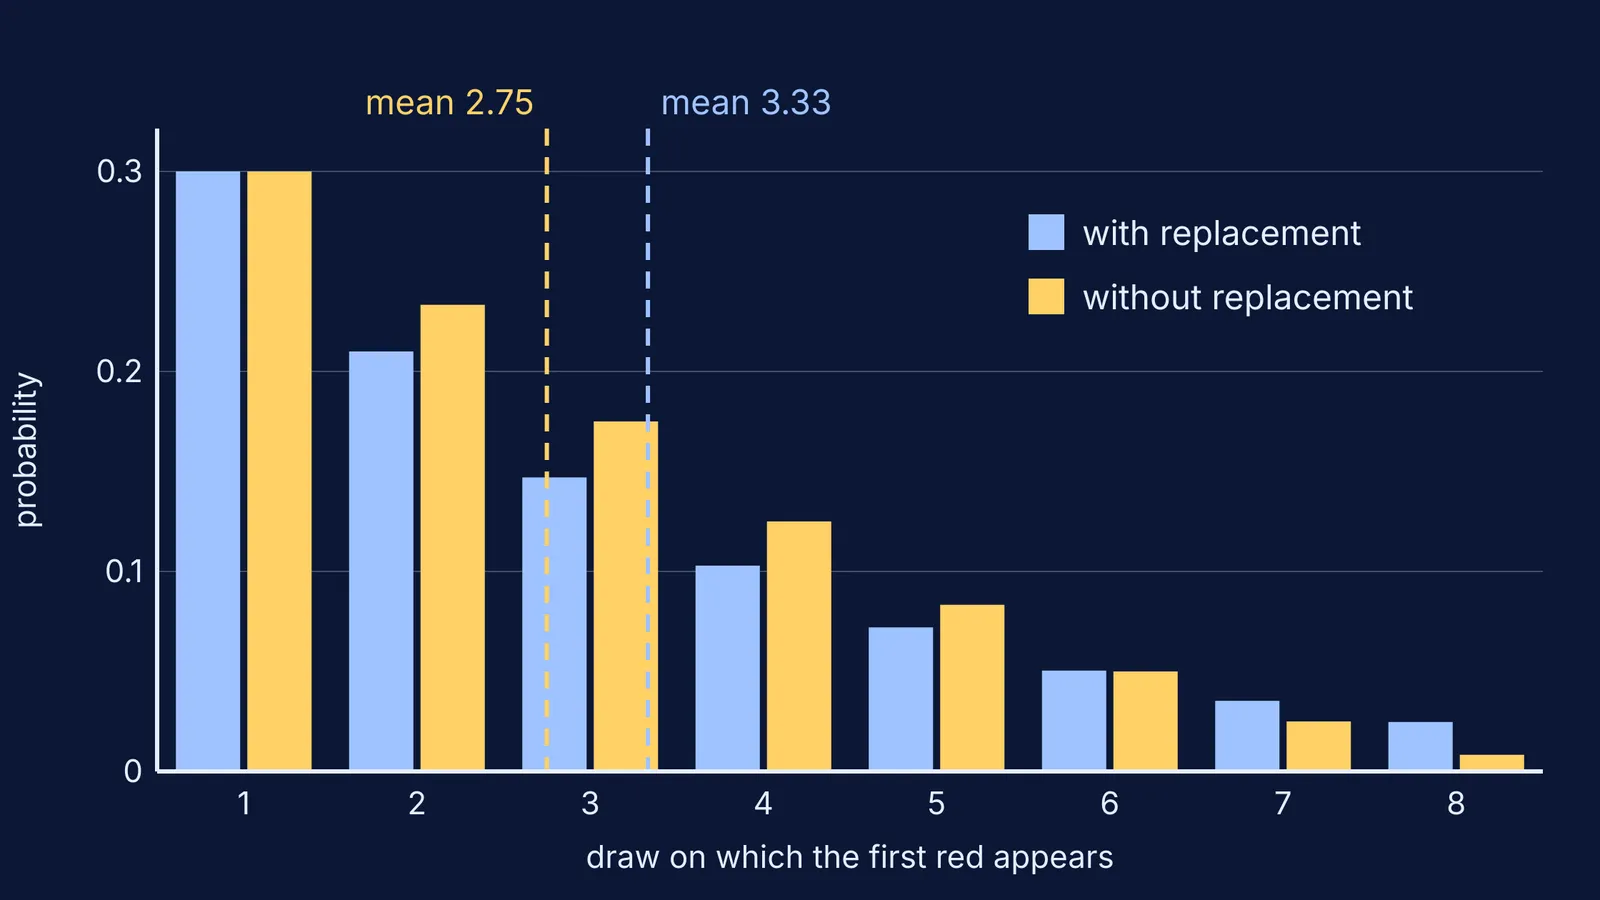
With replacement: 1/(3/10) = 10/3, about 3.33 draws.
Without replacement: (10+1)/(3+1) = 11/4 = 2.75 draws.
The chance that the first red appears on a given draw tells the same story. Here are the exact values, with replacement first and without replacement second:
Draw 1: 0.300 and 0.300
Draw 2: 0.210 and 0.233
Draw 3: 0.147 and 0.175
Draw 4: 0.103 and 0.125
Draw 5: 0.072 and 0.083
Draw 6: 0.050 and 0.050
Draw 7: 0.035 and 0.025
Draw 8: 0.025 and 0.008
Without replacement, you can never need more than 8 draws, because only 7 blues exist. With replacement, there is no ceiling at all, and that long tail is what pulls the average up.
What about the first red card in a deck of 52?
A standard deck has 26 red cards. With replacement, p = 1/2, so you need 2 draws on average. Without replacement, Hjort's formula gives (52+1)/(26+1) = 53/27, about 1.96. The two are close because removing one or two cards barely changes a big deck.
The gap grows when the target is rare. For the first ace, Hjort's paper gives 53/5 = 10.6 cards without replacement, while 1/p with p = 4/52 gives 13 with replacement.
How do you run the trials yourself?
You need 3 red and 7 other-coloured items (balls, beads, or 10 playing cards with 3 red), a bag or a shuffle, and a notebook.
Write your two predictions at the top of the page.
With replacement: draw, note the colour, put it back, shake. Record the draw number on which red first appears. Repeat for 20 trials.
Without replacement: draw until red, keeping the drawn items out. Record the draw number, then return everything. Repeat for 20 trials.
Average each column and compare it with 3.33 and 2.75.
Check the maximum in each column. The without-replacement column should never pass 8.
With only 20 trials your averages will wobble, sometimes by half a draw or more. That is normal: the law of large numbers says averages settle only as trials pile up, and our law of large numbers simulation with 10,000 coin tosses shows it happening.
If you want thousands of trials instead of twenty, the Fermi Simulation Lab has interactive simulations for ideas that are easier to see than to read. For the bigger picture, read our guides on with and without replacement probability problems compared and how to calculate the expected value of a game and test it. And when an exam question twists this setup, the Fermi Problem Library has worked problems with a step-by-step solver that explains the reasoning rather than printing an answer.
Grab a bag and ten balls tonight, and see whose guess at home lands closest.