
On this page
Exam questions often ask you to predict an enzyme curve and explain it. An enzyme simulation gives you three dials: temperature, pH and substrate concentration. Here is what each does, a worked example, and a predict-then-test plan.
What does temperature do to enzyme activity?
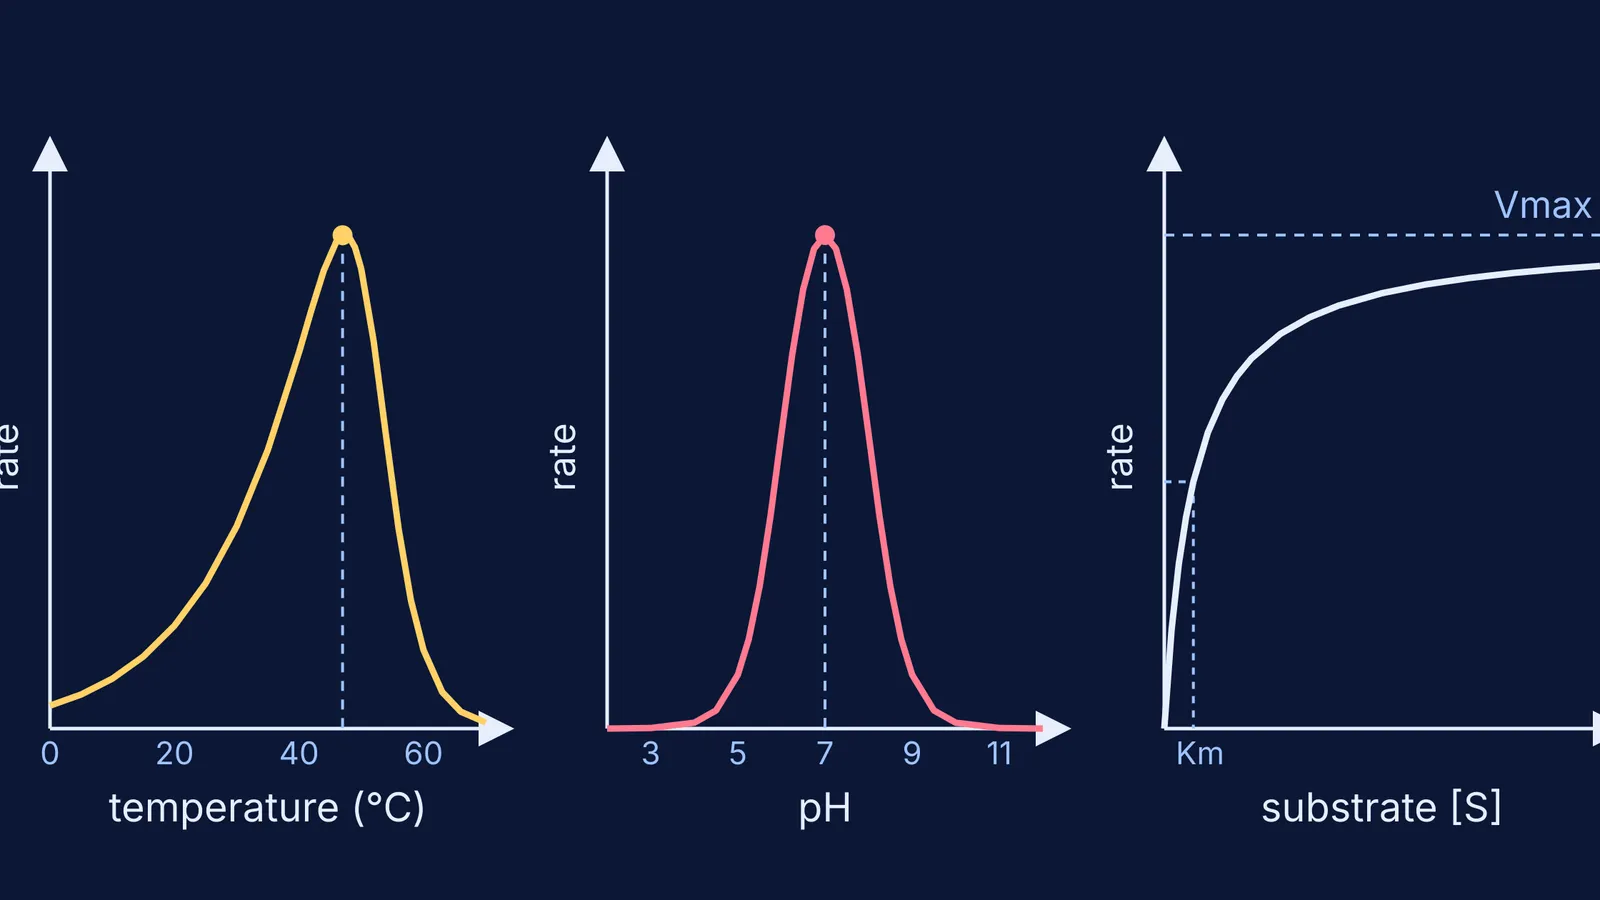
Two things happen at once. OpenStax Biology 2e states that increasing the temperature generally increases reaction rates, enzyme-catalysed or otherwise. Warmer molecules move faster, so they meet more often. The same chapter notes that high temperatures eventually cause enzymes to denature, which changes the shape the active site depends on.
So the curve climbs gradually, peaks at the optimum temperature, then drops steeply. The steep fall is denaturation: once the folded shape is lost, the substrate no longer fits.
In a 2010 review in Trends in Biochemical Sciences, Roy Daniel and Michael Danson argued that activation energy and thermal stability alone do not match experimental data, and described an Equilibrium Model in which the active enzyme is in rapid equilibrium with an inactive, but not denatured, form (Daniel and Danson, 2010). For school exams the two-effect picture is enough; just know the real story includes a reversible step too.
Why does pH change the rate of an enzyme reaction?
A substrate often binds to the active site through ionic bonds to charged groups such as -COO⁻ and -NH3⁺. LibreTexts on the effect of pH explains that at lower pH the -COO⁻ picks up a hydrogen ion, and at higher pH the -NH3⁺ loses one, so either way the bond cannot form. At very high or very low pH, bonds inside the enzyme are disrupted and it can lose its shape.
Each enzyme's optimum suits where it works. The same LibreTexts page gives pepsin, a stomach enzyme, an optimum pH of about 1.5, and trypsin an optimum pH of about 8. Move pH either way from the optimum and the rate falls: expect a peak, not a slope.
Why does the rate level off at high substrate concentration?
An enzyme can only work on substrate that is sitting in an active site. LibreTexts on enzyme kinetics/05%3A_Bioenergetics_-_Thermodynamics_and_Enzymes/5.03%3A_Enzyme_Kinetics) describes Vmax as the rate approached when substrate is so plentiful that every enzyme molecule is occupied. Km is the substrate concentration at which the rate is half of Vmax. The rate follows v = Vmax[S] / (Km + [S]), the relationship named after Leonor Michaelis and Maud Menten, whose 1913 paper was translated into English in 2011 (Johnson and Goody, Biochemistry).
Think of a railway booking office with five counters. When the queue is short, more people means more tickets per minute. Once all five counters are busy, a longer queue changes nothing.
Worked example: how fast do the gains shrink?
Take Vmax = 100 units and Km = 2 mM (made-up but typical-looking values) and use the Michaelis–Menten equation from LibreTexts/05%3A_Bioenergetics_-_Thermodynamics_and_Enzymes/5.03%3A_Enzyme_Kinetics):
[S] = 2 mM: rate = 100 × 2 ÷ 4 = 50
[S] = 4 mM: rate = 100 × 4 ÷ 6 = 66.7
[S] = 8 mM: rate = 100 × 8 ÷ 10 = 80
[S] = 18 mM: rate = 100 × 18 ÷ 20 = 90
[S] = 38 mM: rate = 100 × 38 ÷ 40 = 95
Doubling substrate from 2 to 4 mM adds about 17 units. Going from 18 to 38 mM, more than doubling, adds only 5. Each extra substrate molecule helps less because fewer active sites are free. At that point, the way to go faster is more enzyme, not more substrate.
For inhibition and cofactors, which build on the same curve, see our guide to enzyme kinetics and inhibition for NEET biology.
How do you use an enzyme simulation to find the optimum?
Commit to a prediction first, then use this plan:
Change one dial at a time. Hold pH and substrate fixed while you sweep temperature.
Sketch before you run. Draw your predicted curve, mark where you expect the peak, and write one sentence on why.
Sweep in even steps, then use smaller steps near the peak.
Read the shape, not just the peak. If the fall after the optimum is steeper than the rise before it, you are seeing denaturation.
Test recovery. If you can, heat past the optimum and cool back down. Does the rate return? Explain why.
Repeat for pH at your best temperature, then for substrate at both optima. Mark Vmax, then find Km as the substrate level giving half of Vmax.
Compare with your sketch and write down the one thing you got wrong.
The Fermi Simulation Lab has interactive simulations for the ideas that are easier to see than to read, and this predict, run, explain routine works with any of them. If Km or denaturation still feels shaky afterwards, the Fermi Concept Library gives each biology and chemistry concept its own lesson.
For more on learning with simulations, read what research says about interactive simulations and simulations versus static diagrams.
Pick one dial tonight, sketch your prediction, and then run it.