On this page
First, sketch how the potential changes as you move away from a positive charge, then sketch the field on the same axes. In a study of physics lecture demonstrations, students who passively watched understood the ideas no better than students who saw nothing, while students who predicted the outcome first showed significantly greater understanding (Crouch, Fagen, Callan and Mazur, American Journal of Physics, 2004). So commit to your sketch first, then read on.
What does the electric potential vs distance graph look like for a point charge?
The potential of a point charge is V = kq/r, where k = 8.99 × 10⁹ N·m²/C² and the potential at infinity is chosen to be zero (OpenStax University Physics Volume 2, section 7.3).
That one formula gives you the whole shape:
For a positive charge, V is positive and falls smoothly as r grows. It gets closer and closer to the r-axis but never reaches zero at any finite distance.
Close to the charge, V climbs steeply. For an ideal point charge it has no upper limit as r shrinks, which is why graphs are usually drawn starting a little way out from r = 0.
For a negative charge, the curve is a mirror image below the axis: V is negative and rises towards zero. OpenStax works out that a metal sphere carrying −3.00 nC, which acts like a point charge outside it, gives −539 V at 5.00 cm from its centre (same OpenStax section).
Potential is a scalar, so this graph has no arrows, only one number at each distance.
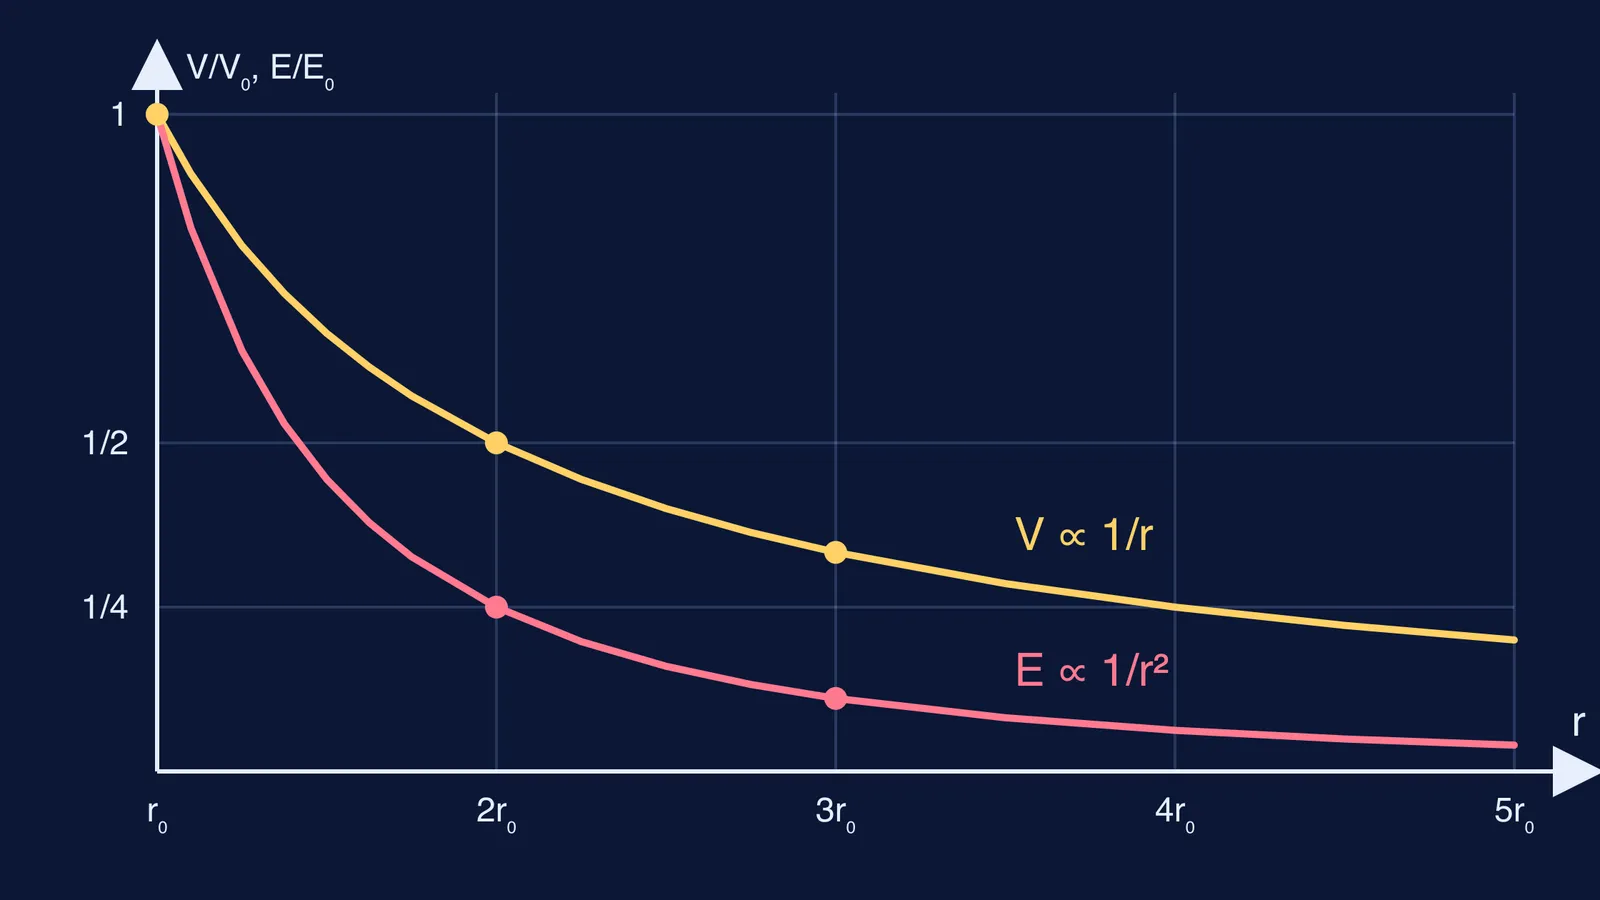
The curve is a rectangular hyperbola: V × r stays constant. Double r and V halves. Triple r and V falls to a third.
How is the electric field graph different?
The field of a point charge is E = kq/r², pointing away from a positive charge and towards a negative one (OpenStax University Physics Volume 2, section 5.4).
Its graph looks similar, but it drops faster. Double r and E falls to a quarter. Triple r and it falls to a ninth. In the graph at the top of this post, both curves start at the same height at r₀; by 2r₀ the field curve is already down to 1/4 while the potential is still at 1/2.
Worked example: a 1 nC charge at 10, 20 and 30 cm
Take q = +1.00 nC and k = 8.99 × 10⁹ N·m²/C², the value given by OpenStax.
At r = 0.10 m: V = (8.99 × 10⁹)(1.00 × 10⁻⁹)/0.10 = 89.9 V, and E = 8.99/0.010 = 899 N/C.
At r = 0.20 m: V is about 45.0 V (half) and E is about 225 N/C (a quarter).
At r = 0.30 m: V is about 30.0 V (a third) and E is about 99.9 N/C (a ninth).
At every distance, E = V/r: at 0.10 m, 89.9 V ÷ 0.10 m = 899 N/C. This holds only for a single point charge.
Why does the field graph fall faster than the potential graph?
The field is the negative slope of the potential: in one direction E = −dV/ds, and applying this to V = kq/r gives E = kq/r² (OpenStax University Physics Volume 2, section 7.4).
So you can read the field off the potential graph: steep curve near the charge, strong field; flat curve far away, weak field. The slope of a 1/r curve shrinks faster than the curve itself, so the field dies away faster than the potential. For more cases, see our post on finding the electric field from the potential gradient.
The same pair of shapes turns up in gravity, with the curves on the attractive side because mass has only one sign. Compare them in graphs of gravitational field and potential for a spherical shell.
How do you practise predicting these graphs?
Use this five-minute drill before any graph question in electrostatics:
Write the formula and circle the power of r.
Predict the sign: which side of the axis does the curve sit on?
Predict the halving test: what is the value at 2r and at 3r?
Predict the slope: where is the curve steepest, and what does that tell you about E?
Only then check, with a calculation like the one above, a textbook figure or a simulation.
The Fermi Simulation Lab has interactive simulations for ideas that are easier to see than to read, so you can make your prediction first and then check it against something you can watch. To see how potential spreads out in two dimensions, read how an equipotential lines simulation shows the shape of potential.
Next time you meet a graph question, sketch first and check second.