

On this page
When preparing for physics exams, knowing how to draw and interpret the graph of gravitational field and potential of a spherical shell—as well as a solid sphere—is a recurring requirement. Because gravity is a conservative field, the geometry of these objects creates distinct graph shapes that test your understanding of Newton's law of universal gravitation and the relationship between field and potential.
Whether you are studying gravitation or its electrostatic twin, grasping these four graph shapes (two for the shell, two for the solid sphere) allows you to answer multiple-choice questions rapidly without needing to re-derive the calculus every time.
What is the difference between gravitational field and potential?
Before sketching the graphs, it helps to pin down what the two axes represent.
The gravitational field (E or g) is the gravitational force experienced per unit mass, measured in N/kg or m/s². It is a vector quantity. Because gravity always attracts, the field points inwards toward the centre of the mass. When graphed by its radial component, it is technically negative, but many exam questions ask you to plot its magnitude, |E| = GM/r².
The gravitational potential (V) is the potential energy per unit mass, measured in J/kg. It is a scalar quantity. Gravitational potential is defined as zero at an infinite distance and decreases as you get closer to the mass, meaning it is always negative (V = -GM/r).
For a deeper dive into this gradient relationship, the same calculus applies to electricity, as seen in Finding E from V: using E = −dV/dx with graphs and formulas.
What is the graph of gravitational field and potential of a spherical shell?
Newton's shell theorem dictates how gravity behaves around a hollow, thin spherical shell of mass M and radius R.
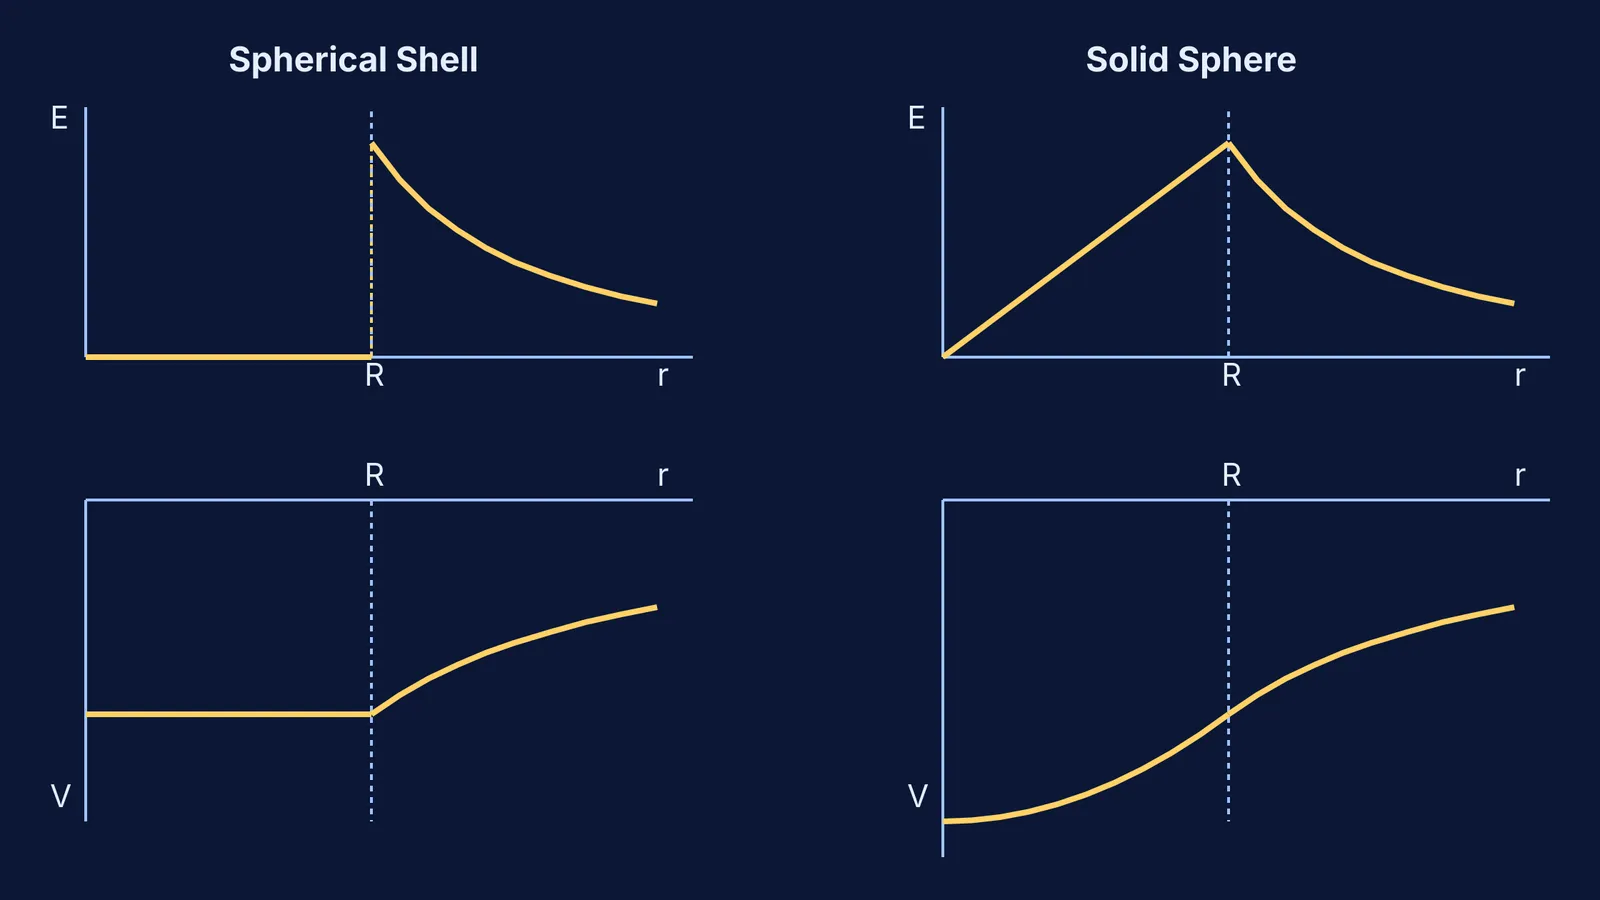
Outside the shell (r ≥ R), the object behaves exactly as if all its mass were concentrated at a single point at its centre. The field magnitude decays according to the inverse-square law (GM/r²), and the potential curves upwards towards zero following an inverse relationship (-GM/r).
Inside the shell (r < R), the gravitational pulls from all sides of the shell perfectly cancel out. This means the gravitational field inside a hollow shell is exactly zero.
Because the field is zero, no work is done moving a mass around inside the shell. Consequently, the gravitational potential cannot change; it remains constant. To keep the graph continuous, the potential inside must equal the potential at the surface. Therefore, the potential graph for r < R is a flat horizontal line at -GM/R.
Because gravity in three dimensions can be hard to picture, the Fermi Simulation Lab provides interactive simulations for the ideas that are easier to see than to read. You can watch how these force vectors cancel out across different geometries. This also perfectly mirrors the behaviour of charges, as explained in Concentric spherical shells: charges, potentials and earthing one.
How do a solid sphere's graphs differ from a shell?
A uniform solid sphere behaves differently on the inside because as you tunnel towards the centre, only the mass enclosed by your current radius contributes to the net gravitational pull.
For the gravitational field, as you move outward from the centre (r = 0) to the surface (r = R), the enclosed mass grows faster than the inverse-square distance diminishes it. The result is a direct, linear relationship: E = GMr/R³. The field graph inside a solid sphere is a straight diagonal line starting at the origin and peaking at the surface.
For the gravitational potential, integrating this linear field yields a quadratic curve (a parabola). At the surface, the potential is -GM/R, but it continues to drop as you go deeper, reaching its lowest point at the centre. The central potential is exactly 1.5 times the surface potential, or -3GM/2R. The electrostatic equivalent of this is derived in Potential at the centre of a uniformly charged solid sphere: 3kQ/2R.
Outside the solid sphere (r ≥ R), the graphs for both field and potential look completely identical to those of the hollow shell. If you need to revise the foundational math behind these derivations, the Fermi Concept Library contains every concept in physics, chemistry, biology, mathematics and computing, each with its own lesson and its place in the map.
How can you quickly sketch the graphs in an exam?
When an exam asks you to draw or identify these plots, use this mental checklist to construct them rapidly:
Draw the surface boundary: Mark a vertical dashed line at r = R. The outside curves (1/r² and 1/r) always start here.
Fill in the shell's inside: To the left of r = R, drop the field straight to the horizontal axis (zero). For the potential, draw a perfectly flat horizontal line linking the y-axis to the surface value.
Fill in the solid sphere's inside: Connect the origin to the field's maximum surface value with a straight diagonal line. For the potential, draw a gentle downward parabola from the surface value that bottoms out at 1.5 times the depth on the y-axis.


