
On this page
In 1942 the Allies planned to put troops ashore in North Africa, where, as Walter Munk's Wikipedia biography puts it, "two out of every three days the waves are above six feet". Planners needed to know which days boats could reach the beach. Two scientists at the Scripps Institution of Oceanography in California worked out how to tell them.
How did Walter Munk and Harald Sverdrup forecast waves?
Harald Sverdrup directed Scripps from 1936 to 1948, and Munk was his doctoral student (Wikipedia)). The Royal Society's biographical memoir of Munk says the pair "developed wave prediction schemes that were used by the Allies in World War II to evaluate whether amphibious landings would be feasible."
The heart of the method was an empirical law relating wave height and period to the wind's speed, how long it had blown, and the distance it blew over, called the fetch (Wikipedia). A NOAA guide for mariners still lists the same three factors.
The method got its first test in Operation Torch, the 1942 North Africa landings, where it helped find a window in which boats could land, reports the University of California. Munk created the first wave prediction course at Scripps and trained military meteorologists (Walter Munk Foundation). A team led by two of those officers used the model to inform the D-Day forecast and correctly predicted that the waves at Normandy on 6 June 1944 would be "high but manageable" (University of California).
What is significant wave height?
Sverdrup and Munk introduced "significant waves", a kind of average height and period for a random sea (Mitsuyasu, Proceedings of the Japan Academy).
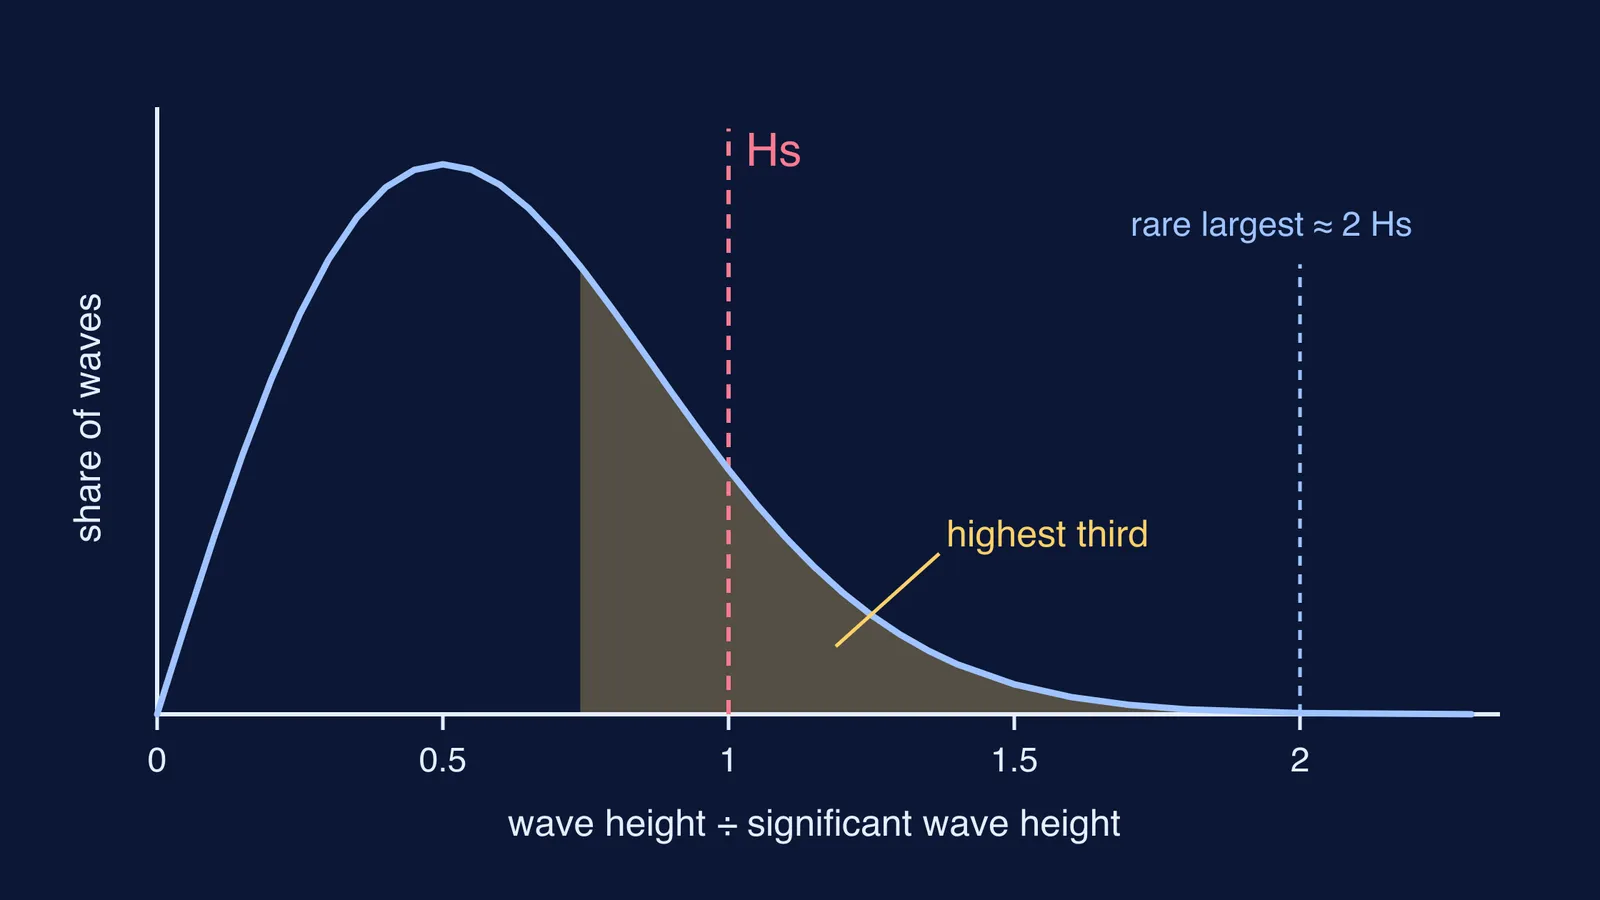
Significant wave height is the average height, trough to crest, of the highest one-third of the waves in a given period (US National Weather Service). The idea was to put a number on the height a trained observer would report (Wikipedia).
India's ocean forecasters use the same definition. INCOIS issues ocean state forecasts at 3-hour intervals for the next 5 to 10 days, for fishermen, the Indian Navy, the Coast Guard and shipping.
How do you read a wave forecast like Munk would?
The rules for this worked example come from the National Weather Service and the deep-water wave equations in Stewart's Introduction to Physical Oceanography/16:_Ocean_Waves/16.1:_Linear_Theory_of_Ocean_Surface_Waves).
Part 1: what does "1.2 m seas" mean? Say the forecast for a beach gives a significant wave height of 1.2 m.
About 15% of waves will equal or exceed 1.2 m.
Occasional waves will be 25-30% higher, around 1.5 to 1.6 m.
The largest single wave may be about twice the significant height, roughly 2.4 m.
So plan for the biggest wave, not the headline number.
Part 2: when will a distant storm's swell arrive? In deep water a wave crest travels at c = gT/2π, where T is the period, and a group of waves travels at half that speed. Swell energy arrives at the group speed.
For T = 15 s: c = 9.81 × 15 ÷ 6.28 ≈ 23.4 m/s, so the group speed is about 11.7 m/s.
That is about 1,010 km per day.
A storm 2,000 km away sends its 15 s swell in about 2 days, roughly 47 hours.
For T = 12 s: group speed ≈ 9.4 m/s, about 810 km per day, so the 12 s waves arrive after about 59 hours.
The long-period waves come first. Munk and colleagues saw this pattern with an array of pressure gauges off San Clemente Island, and used the arrival pattern to work out how far away storms were (Stewart/16:_Ocean_Waves/16.1:_Linear_Theory_of_Ocean_Surface_Waves)).
If the idea of a wave group moving slower than its crests is hard to picture, the Fermi Simulation Lab has interactive simulations for ideas that are easier to see than to read. To practise numericals like Part 2, the Fermi Problem Library has worked problems with a step-by-step solver that explains the reasoning.
What did Walter Munk discover about tides?
After the war Munk turned to tides. In a 1966 paper with David Cartwright, Tidal spectroscopy and prediction, he analysed 19 years of hourly tide records from Honolulu and Newlyn in England, computing the tide-raising forces directly from the orbits of the Moon and the Sun. This became the "response method" of tidal analysis (Wikipedia).
In 1969 he began measuring tides in the deep ocean with pressure sensors dropped to the sea floor and brought back by acoustic release (Walter Munk Foundation). The tides the Moon raises on Earth also affect its orbit: laser ranging shows the Moon moving away by about 3.8 cm a year (NASA JPL). For why there are two high tides a day, see our tidal forces drawn as arrows.
In 2010 Munk won the Crafoord Prize "for his pioneering and fundamental contributions to our understanding of ocean circulation, tides and waves, and their role in the Earth's dynamics." He died in 2019, aged 101 (Royal Society memoir).
Next, read how his doctoral adviser gave his name to the sverdrup unit of ocean current flow, or follow a wave to the beach with why sea waves break near the shore.