
On this page
Takuo Aoyagi was a Japanese engineer. He graduated in electrical engineering from Niigata University in 1958 and joined the medical-electronics company Nihon Kohden in 1971, according to a 2021 tribute in the Journal of Anesthesia. He died on 18 April 2020. His story is school physics doing real work, and it began with a nuisance he refused to ignore.
What did Takuo Aoyagi discover in 1974?
Aoyagi was not trying to measure oxygen. He was measuring how much blood the heart pumps by injecting a dye and following it with light shone through the earlobe. The pulse kept spoiling the signal: in his words, quoted in the tribute, the pulsations "prevented accurate extrapolation of the down-slope of the dye curve after recirculation begins."
He analysed it with the Beer–Lambert law, which links the light absorbed to the amount of absorbing substance in its path. He "conceived the idea of eliminating the pulsation by computing the ratio of optical densities of the two wavelengths". That ratio became the heart of pulse oximetry. His prototype used 630 nm and 900 nm light.
Nihon Kohden filed a Japanese patent application in 1974, the year Aoyagi first presented the work at the spring meeting of the Japanese Society of Medical Electronics and Biological Engineering, the tribute records. The IEEE milestone page dates the principle to 1972 and the first ear pulse oximeter, the OLV-5100, to 1975.
Recognition came slowly: John Severinghaus of the University of California, San Francisco, publicised Aoyagi's role to the world in 1986, more than a decade after the patent application, the tribute notes.
How do red and infrared light measure blood oxygen?
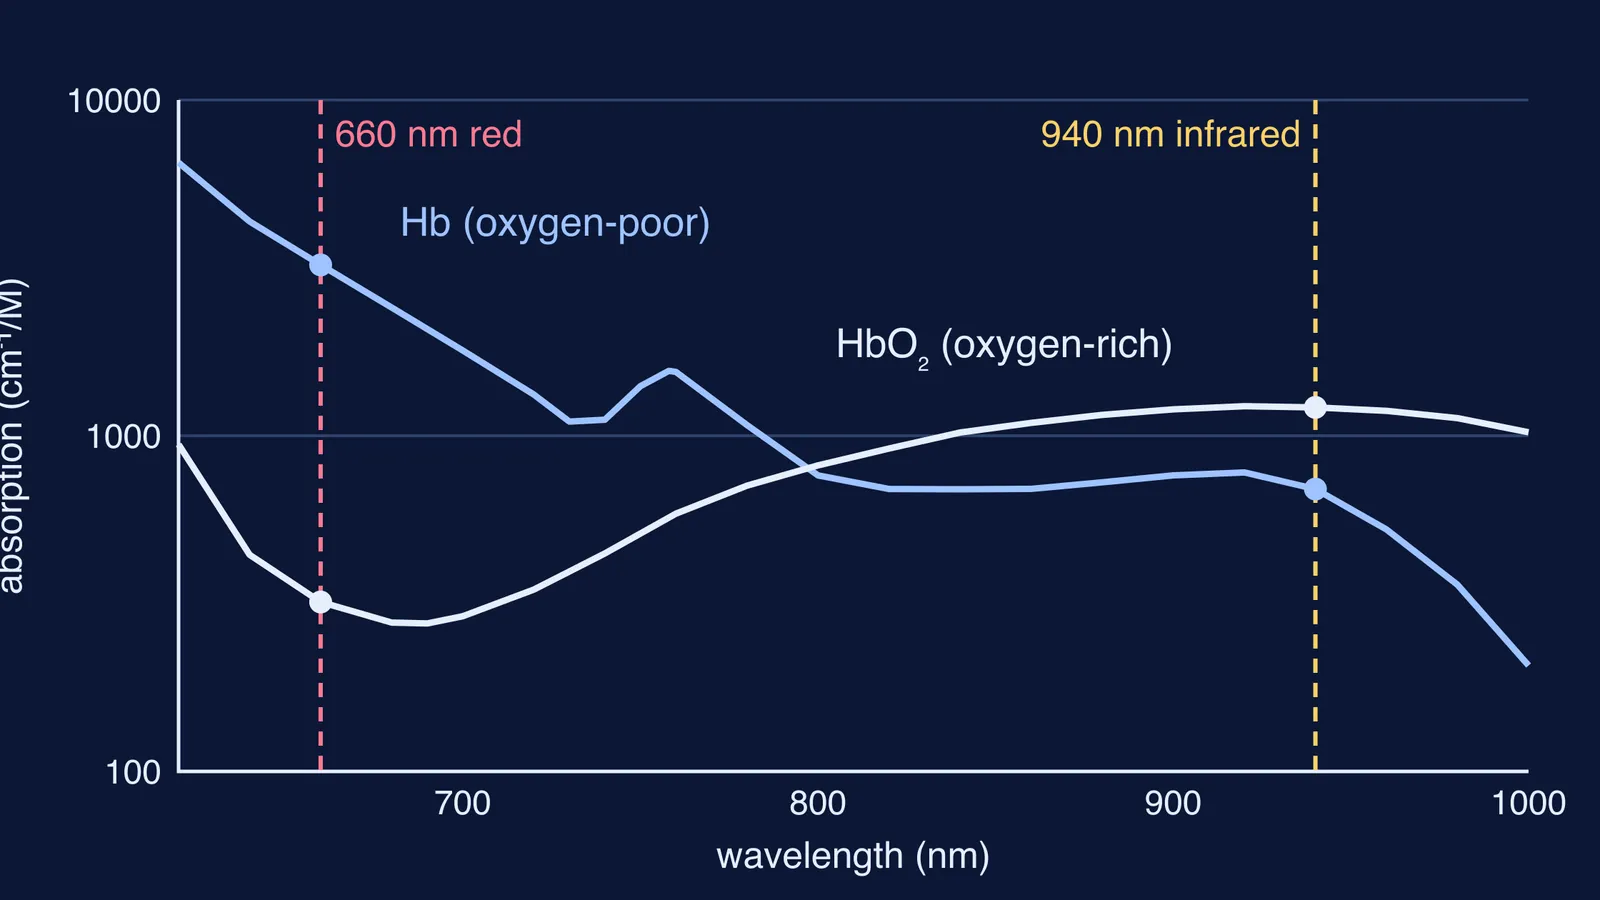
Oxygen-rich haemoglobin absorbs more infrared light and lets more red light through, while oxygen-poor haemoglobin does the opposite, as the University of Iowa's pulse oximetry protocol explains.
At 660 nm, oxygen-poor haemoglobin absorbs about 10 times as strongly as oxygen-rich haemoglobin (3,227 against 320, in molar extinction units), in the haemoglobin absorption table compiled by Scott Prahl. At 940 nm the order flips: 1,214 for oxygen-rich against 693 for oxygen-poor, in the same table.
A typical modern clip uses a red LED at 660 nm and an infrared LED at 940 nm facing a light sensor, according to the IEEE milestone page. Each heartbeat pushes a little more arterial blood under the sensor, so the light reaching it dips with every pulse. The device divides the pulsing part of the signal by the steady part at each wavelength, then divides red by infrared: the "ratio of ratios".
How does the ratio change as oxygen falls?
Check this worked example with a calculator. Let a fraction S of the pulsing blood be oxygen-rich. With the Prahl table, absorption at each wavelength is S × (oxygen-rich value) + (1 − S) × (oxygen-poor value), and R is red divided by infrared.
S = 0.98: red = 0.98 × 320 + 0.02 × 3,227 ≈ 378; infrared = 0.98 × 1,214 + 0.02 × 693 ≈ 1,204; R ≈ 0.31.
S = 0.90: red ≈ 611; infrared ≈ 1,162; R ≈ 0.53.
S = 0.80: red ≈ 901; infrared ≈ 1,110; R ≈ 0.81.
As oxygen falls, R rises steeply, because oxygen-poor blood absorbs red light so strongly, and each R matches one oxygen level. Real tissue also scatters light, so this shows the shape of the idea, not a clinical reading; a real oximeter converts the ratio with a lookup table, as the Wikipedia article on pulse oximetry describes.
Light, absorption and a pulsing signal at once are easier to see than to read, which is what the interactive simulations in the Fermi Simulation Lab are for.
Why can a pulse oximeter reading be wrong?
The US Food and Drug Administration says a pulse oximeter "uses light beams to estimate a person's blood oxygen level", and that poor circulation, skin pigmentation, skin thickness, skin temperature, tobacco use and nail polish can affect accuracy, on its pulse oximeter basics page. It adds that current evidence suggests some accuracy differences between people with lighter and darker skin pigmentation. Carbon monoxide can also make the reading too high, the Iowa protocol notes.
So a reading is an estimate from light, not a diagnosis.
What can students learn from Aoyagi's method?
Try his habit on your next messy practical:
Name the nuisance. What is spoiling your data, and when?
Find its physics. Write the law behind it, as Aoyagi did with Beer–Lambert.
Look for a ratio. Dividing two measurements often cancels unknowns such as path length.
Test with numbers, as in the worked example, and check the result moves the way you expect.
If the Beer–Lambert law or logarithms are the gap, the Fermi Concept Library has a lesson for every concept in physics, chemistry, biology, mathematics and computing.
Next time you see a fingertip clip, you will know it is shining two colours of light and watching for a heartbeat.