On this page
A distant star is one point of light. Sara Seager, now a professor of planetary science, physics and aerospace engineering at MIT (her official website), worked out how that light could tell us what the air is like on a planet circling the star.
What did Sara Seager work out about exoplanet atmospheres?
Astronomers had just watched the gas giant HD 209458 b pass in front of its Sun-like star. In their paper Theoretical Transmission Spectra during Extrasolar Giant Planet Transits (The Astrophysical Journal, 2000, DOI 10.1086/309088), Seager and co-author D. D. Sasselov explained the basic idea: the planet's atmosphere stamps its absorption features onto the starlight that passes through it, just above the planet's edge.
They used their models of hot giant planets to estimate which features would be strong enough to see. Their promising candidates were the sodium and potassium lines, and a helium line at 1083.0 nm, all listed in the paper's abstract. They added that such measurements could reveal how deep the clouds sit.
How does starlight reveal an exoplanet's gases during a transit?
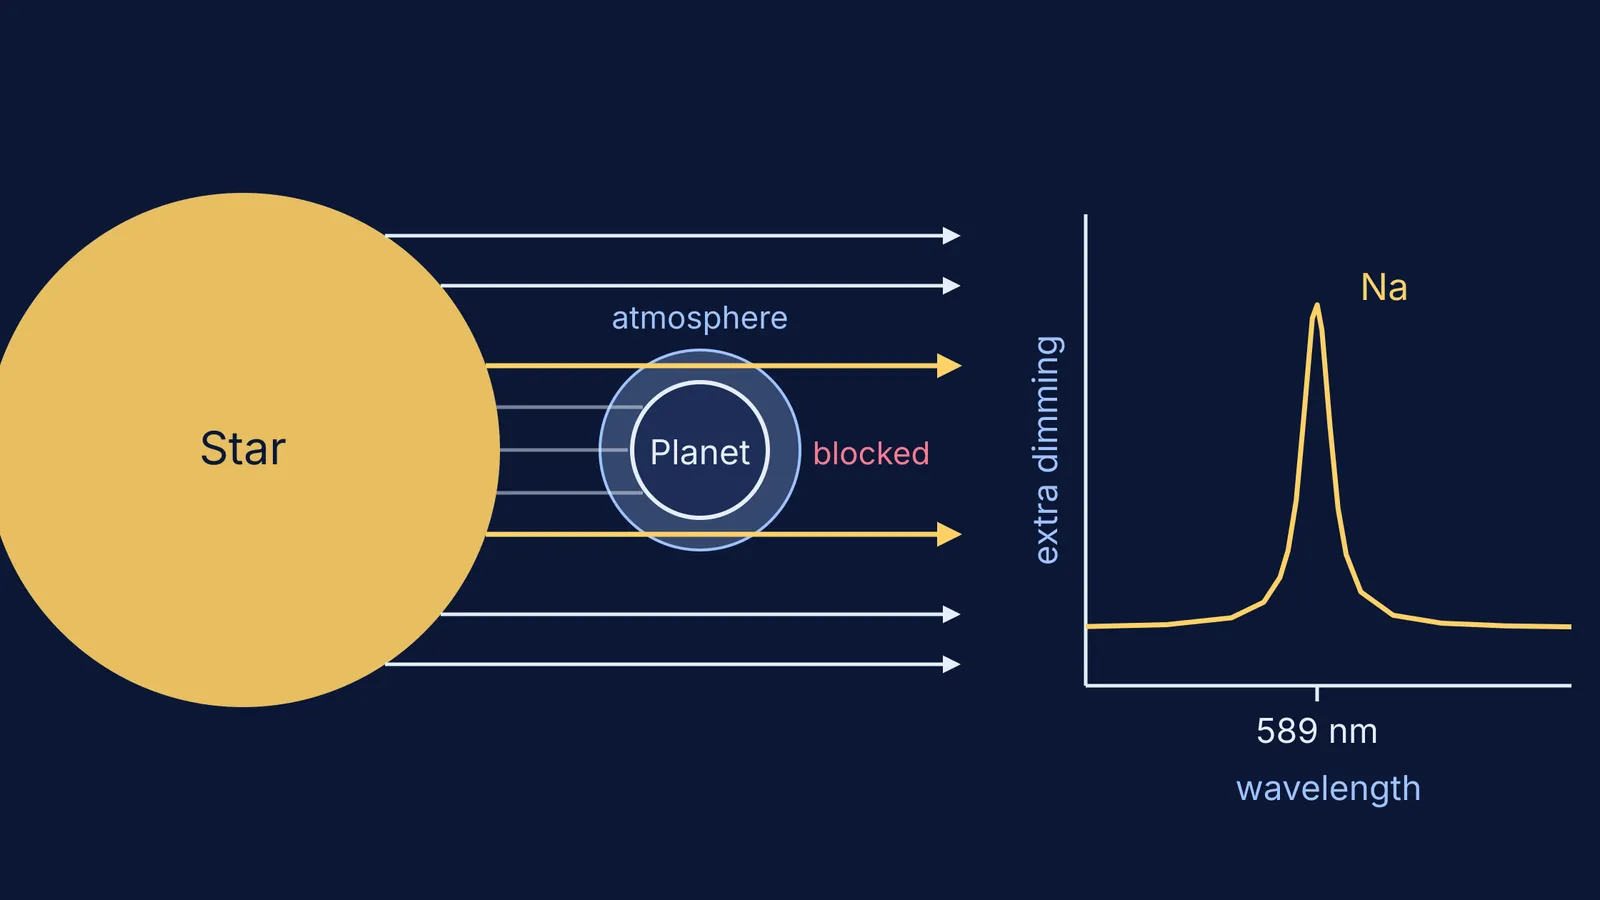
A transit is when a planet passes between its star and us, so the star dims slightly. Most blocked light hits the planet's opaque body, but a thin ring of light grazes the edge and passes through the atmosphere.
As NASA puts it, some starlight is blocked completely and some is transmitted through the atmosphere, and because different gases absorb different combinations of colours, small brightness differences across wavelengths show what the atmosphere is made of.
So here is the logic, step by step:
At most wavelengths, the atmosphere is fairly clear, and the planet looks about as big as its opaque disc.
At a wavelength a gas absorbs strongly, such as sodium's yellow line, the atmosphere becomes opaque higher up.
The planet looks a little bigger at that wavelength, so it blocks a little more light.
Plot the extra dimming against wavelength and you get the planet's transmission spectrum, with peaks where its gases absorb.
This is the same absorption-line physics you meet with the Beer-Lambert law of absorption, just with a planet's air as the sample cell.
How was Seager's prediction confirmed?
David Charbonneau and colleagues used the Hubble Space Telescope to watch four transits of HD 209458 near the sodium doublet at 589.3 nm. In their paper Detection of an Extrasolar Planet Atmosphere (The Astrophysical Journal, 2002, DOI 10.1086/338770), they reported that the dimming in the sodium band was deeper by 2.32 × 10⁻⁴ than in the bands beside it, and read this as sodium absorbing in the planet's atmosphere.
They saw less sodium than a cloud-free model predicted; one possible reason they listed was clouds high in the atmosphere.
The MacArthur Foundation, which gave Seager a fellowship in 2013, notes that her early predictions led to the first detection of an exoplanet atmosphere by Hubble. In 2024, Seager and Charbonneau shared the Kavli Prize in Astrophysics "for their ground-breaking work on the discovery and characterization of extra-solar planets and their atmospheres."
Webb's NIRSpec instrument later used the same method to find carbon dioxide in the atmosphere of WASP-39 b, between 4.1 and 4.6 microns. If you have wondered why Webb works in that range, see why the James Webb telescope sees in infrared.
How small is the sodium signal in a transit?
Seager and Sasselov estimated that the area of a planet's transparent atmosphere is only about 10⁻³ to 10⁻⁴ of the star's area, according to their abstract. Check it with school geometry, using round practice numbers rather than the real planet's.
Say the planet's radius is 0.1 of the star's radius. The fraction of the star's disc it covers is (0.1)² = 0.01, so the star dims by 1%.
Now add an atmosphere ring of thickness h. Its area is about 2πR_p h, so the extra dimming is 2R_p h / R_s².
Set that equal to Hubble's sodium signal of 2.32 × 10⁻⁴ (Charbonneau et al.). With R_p = 0.1R_s, you get h = 2.32 × 10⁻⁴ ÷ 0.2 = 1.16 × 10⁻³ of the star's radius, about 1.2% of the planet's radius.
The extra sodium dip is roughly 43 times smaller than the transit itself (0.01 ÷ 0.000232). That is why the prediction mattered: it told observers exactly which narrow colour to stare at.
How can you use this idea when you study spectra?
The transit method ties together chapters you may have studied separately. Try this checklist:
Can you explain why each element absorbs only at certain wavelengths?
Can you sketch an absorption spectrum and say what a dark line means?
Can you work out the area ratio of two circles and turn it into a percentage?
Can you explain why a planet looks bigger at wavelengths where its air absorbs?
If the energy-level idea is shaky, the Fermi Concept Library has a lesson for every concept in physics and chemistry. If you would rather watch light being absorbed than read about it, the Fermi Simulation Lab has interactive simulations for ideas that are easier to see than to read.
If this is the kind of work you would like to do, read our guide to becoming an astronomer through India's research institutes.