

On this page
On 12 June 1897 a great earthquake struck Assam. Richard Dixon Oldham of the Geological Survey of India was the only officer at headquarters who had paid any attention to earthquakes, says his Royal Society obituary by C. Davison. His report, published in 1899 in the Memoirs of the Geological Survey of India, described the Chedrang fault, where the ground was lifted 35 feet at one point. But Davison singles out as perhaps the most important part a chapter about places that never felt the shaking at all.
What did Oldham see on the 1897 seismograms?
Oldham called that chapter "the unfelt earthquake". Davison's obituary records that the traces from eleven stations between 4,300 and 4,900 miles from the centre "revealed for the first time the existence of three phases of motion" (Davison, 1936).
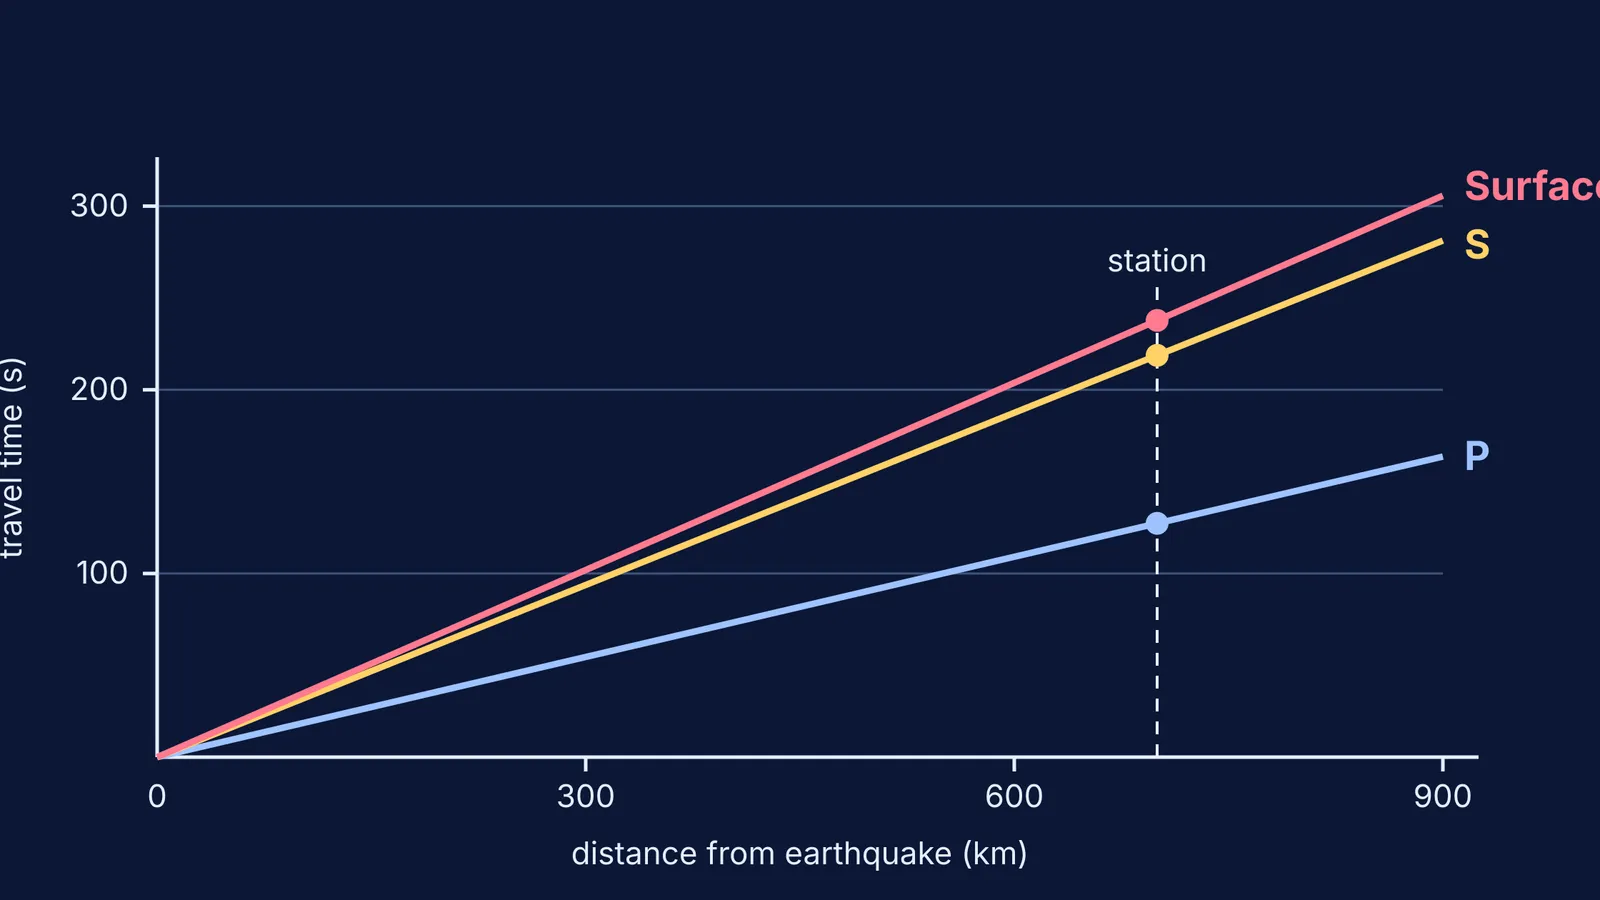
The three phases, in the order they arrived:
A first set of small tremors, which Oldham linked to compressional waves (he called them "condensational") crossing the body of the Earth. Today we call these P, or primary, waves.
A second set of tremors, which he linked to distortional waves, also crossing the body of the Earth. These are today's S, or secondary, waves.
Large, slow undulations that had travelled round the surface. These are surface waves.
In his 1900 paper, On the propagation of earthquake motion to great distances, he tested the pattern on six other earthquakes: four in Japan, one in Argentina and one in Turkestan, as Davison's obituary lists.
Why do P, S and surface waves arrive at different times?
Each is a different kind of motion. A Geological Survey of India explainer by J.R. Kayal sets out the differences:
P waves push and pull the rock along the direction of travel, like sound. They pass through solids and liquids.
S waves shear the rock sideways, at right angles to the direction of travel. A liquid cannot hold a shear, so S waves cannot cross it.
Surface waves stay near the ground. Rayleigh waves, one type, travel at about nine-tenths of the S-wave speed.
In the shallow crust, Kayal gives apparent speeds of about 5.5 km/s for P waves and 3.2 km/s for S waves (Kayal). Near the source the arrivals bunch together. Far away the gaps widen, which is why Oldham's distant stations, 4,300 to 4,900 miles (roughly 6,900 to 7,900 km) away, showed three distinct groups.
For why shear needs a rigid medium, see our explainer on why transverse waves cannot travel through gases.
How did the three phases lead to Earth's core?
Oldham's 1906 paper, The constitution of the interior of the Earth, as revealed by earthquakes, compares the seismograph to the spectroscope in astronomy in its introduction.
In that paper, the Linda Hall Library explains, he showed that P waves faded out about 120 degrees from the epicentre and picked up again farther on, while S waves either reappeared much altered or vanished. He concluded that Earth has a large core, with a radius about 40% of Earth's.
The same reasoning later pointed to a liquid outer core: it does not transmit shear waves, as Kayal's explainer notes. For the Indian side of this physics, see why Delhi sits in a high earthquake zone, or read how a seismologist of the same era, Akitsune Imamura, warned of a great Kanto earthquake.
How can you use Oldham's idea to find an earthquake's distance?
The P-to-S gap tells you how far away the earthquake was. A worked example using Kayal's shallow-crust speeds of 5.5 km/s (P) and 3.2 km/s (S).
Suppose a station's record shows the S wave arriving 20 s after the P wave.
Write each travel time: t(P) = d / 5.5 and t(S) = d / 3.2, with d in km and t in s.
Subtract: t(S) - t(P) = d (1/3.2 - 1/5.5) = 0.1307 d.
Set 0.1307 d = 20, so d is about 153 km.
Check: 153 / 3.2 is about 47.8 s and 153 / 5.5 is about 27.8 s, a gap of 20 s.
With these speeds, each second of S-P gap means about 7.7 km. One station gives you a distance, which is a circle on the map; three stations' circles cross at the epicentre. These are shallow-crust speeds for nearby records, so this fixed-speed method suits exam numericals and nearby events, not distant ones.
Reading a seismogram? Run this checklist:
The first small wiggle is P; the second, larger one is S.
The biggest, longest swings are surface waves.
The S-P gap gives distance.
Missing S waves mean something liquid is in the way.
If push-pull and side-to-side motion still feel abstract, the Fermi Simulation Lab has interactive simulations for ideas that are easier to see than to read. If you set up numericals like the one above but lose marks on the algebra, the Fermi Problem Library has a step-by-step solver that explains the reasoning rather than printing an answer.
Next time you see a seismogram, try what Oldham did: find the three groups, then ask what path each one took.


