

On this page
In 1905 Albert Einstein suggested that light delivers its energy in packets, each worth h times the light's frequency. Robert Millikan doubted the idea. He spent about a decade trying to test it. In his 1924 Nobel lecture he said the work ended "contrary to my own expectation": the equation held, and its graph handed him Planck's constant.
What did Einstein's photoelectric equation predict?
Einstein's paper appeared in Annalen der Physik in 1905. Millikan's lecture writes the equation as ½mv² = hν − P. The left side is the energy of the fastest escaping electron. hν is the energy of one packet of light. P is the work needed to pull the electron out of the metal, which your textbook calls the work function, φ.
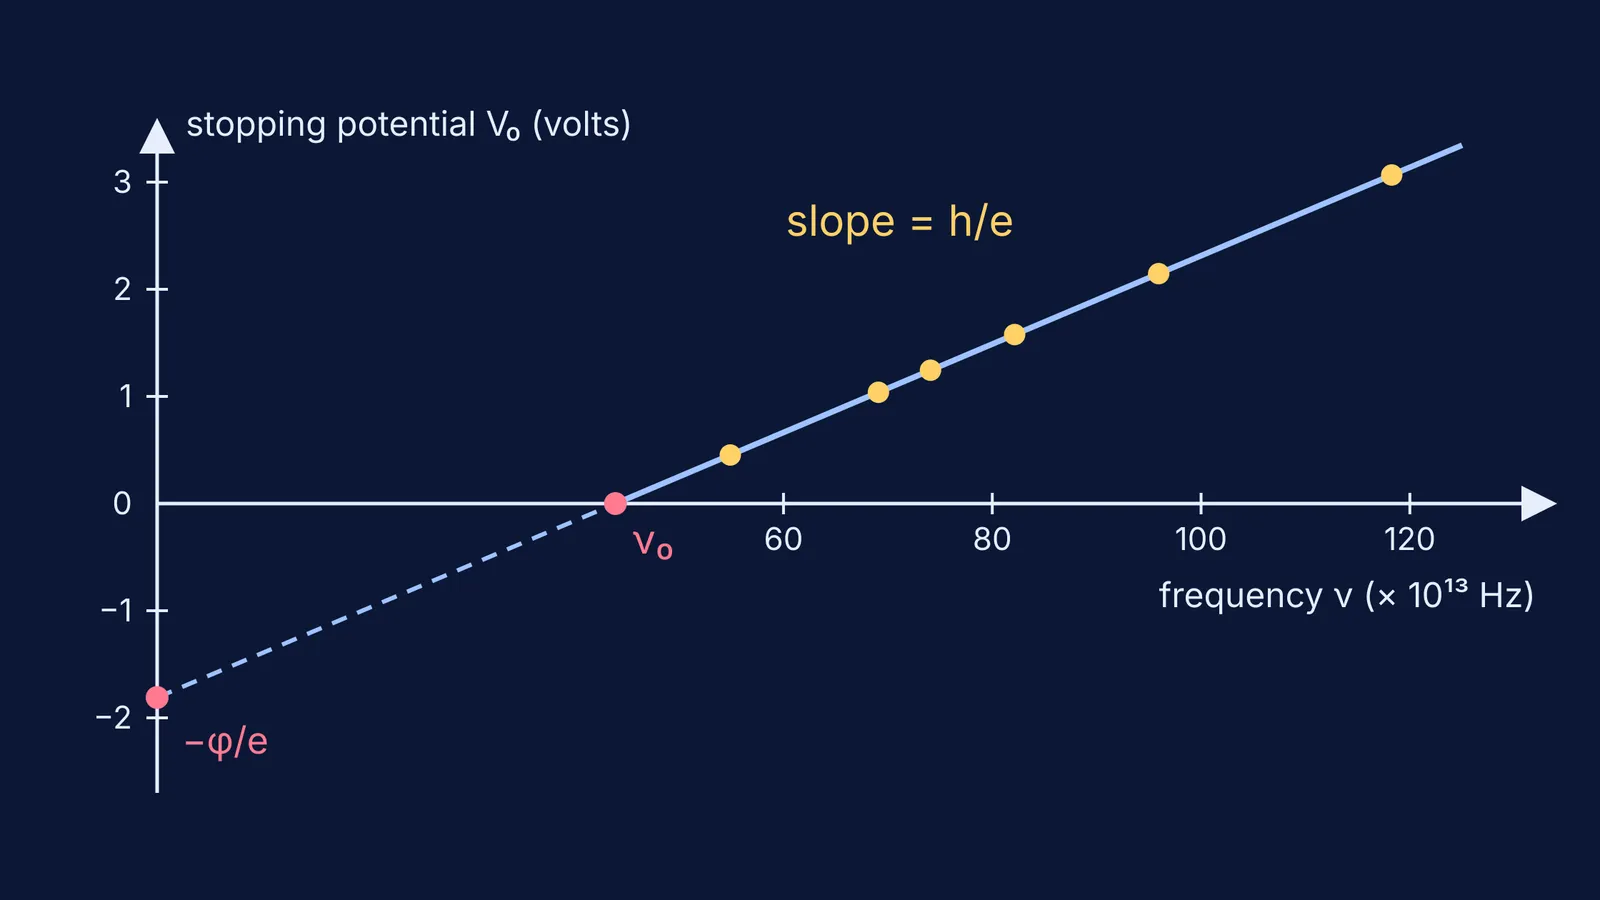
In the lab you measure the stopping potential V₀. This is the reverse voltage that just stops the fastest electrons, so eV₀ = hν − φ. Rearranged, V₀ = (h/e)ν − φ/e. That is the equation of a straight line. Its slope, h/e, should be the same for every metal, and only the threshold frequency should change.
The wave theory of light predicts nothing like this. The lecture credits Philipp Lenard with finding, in 1902, that the electrons' energy does not depend on how bright the light is. For the full argument, see why the wave theory fails to explain the photoelectric effect.
How did Millikan verify Einstein's equation?
Millikan says in his Nobel lecture that he had been looking since 1904 for a crucial test of the idea of localized light energy. He then describes "ten years of testing and changing and learning and sometimes blundering". In that time he measured electron energies as he varied the temperature, the wavelength and the metal.
The lecture shows his best data, taken on sodium at six wavelengths from 2535 ångströms in the ultraviolet to 5461 ångströms in the visible. For each wavelength he found the voltage that cut the photocurrent to zero, and then plotted those voltages against frequency. The points fell on a straight line.
He published the result in Physical Review in March 1916 as A Direct Photoelectric Determination of Planck's h. In the lecture he dates the proof to 1914 and states the accuracy as about 0.5%.
The Nobel Prize in Physics 1923 went to Millikan "for his work on the elementary charge of electricity and on the photoelectric effect". Einstein's 1921 prize was awarded "especially for his discovery of the law of the photoelectric effect".
How do you get Planck's constant from the graph?
You can redo Millikan's calculation using the sodium numbers printed on Fig. 4 of his Nobel lecture.
Read the slope. On his line, the voltage changes by 3 volts between 48.25 × 10¹³ Hz and 121.00 × 10¹³ Hz.
Divide: 3 ÷ (72.75 × 10¹³) = 4.124 × 10⁻¹⁵ volt-seconds. This slope is h/e.
Multiply by e. Using today's exact value from NIST, e = 1.602176634 × 10⁻¹⁹ C, you get h ≈ 6.61 × 10⁻³⁴ J s.
Compare. NIST fixes h at 6.62607015 × 10⁻³⁴ J s, so his slope is within about 0.3% of it.
Find the work function. The threshold marked on his graph is 43.9 × 10¹³ Hz, so φ = hν₀ ≈ 2.9 × 10⁻¹⁹ J, or about 1.8 eV.
Millikan used his own oil-drop value of e, 4.774 × 10⁻¹⁰ electrostatic units, and got h = 6.56 × 10⁻²⁷ erg s. That is the same as 6.56 × 10⁻³⁴ J s.
What mistakes do students make with stopping-potential graphs?
Before you answer a stopping-potential question in a board exam or JEE Main, check:
The slope is h/e, not h. Multiply by e, or remember that the slope in V/Hz equals h measured in eV s.
Different metals give parallel lines. The slope stays the same and the threshold moves.
Brighter light gives more current but the same V₀.
Extend the line back to ν = 0 and it cuts the voltage axis at −φ/e. It cuts the frequency axis at ν₀.
Watch the powers of ten on the axes. A common slip is reading 10¹³ as 10¹⁴.
For more practice, see our worked guide to the slope of the stopping potential vs frequency graph. If the straight line still feels abstract, the Fermi Simulation Lab has interactive simulations for ideas that are easier to see than to read. If you keep getting the method wrong, the Fermi Problem Library has worked problems with a step-by-step solver that explains the reasoning.
What can you learn from Millikan's decade?
Millikan looked for a crack in a theory he doubted, and his own data closed it. A good experiment is one that could have proved you wrong. For where the story began, read how Hertz's spark gap revealed the photoelectric effect.


