On this page
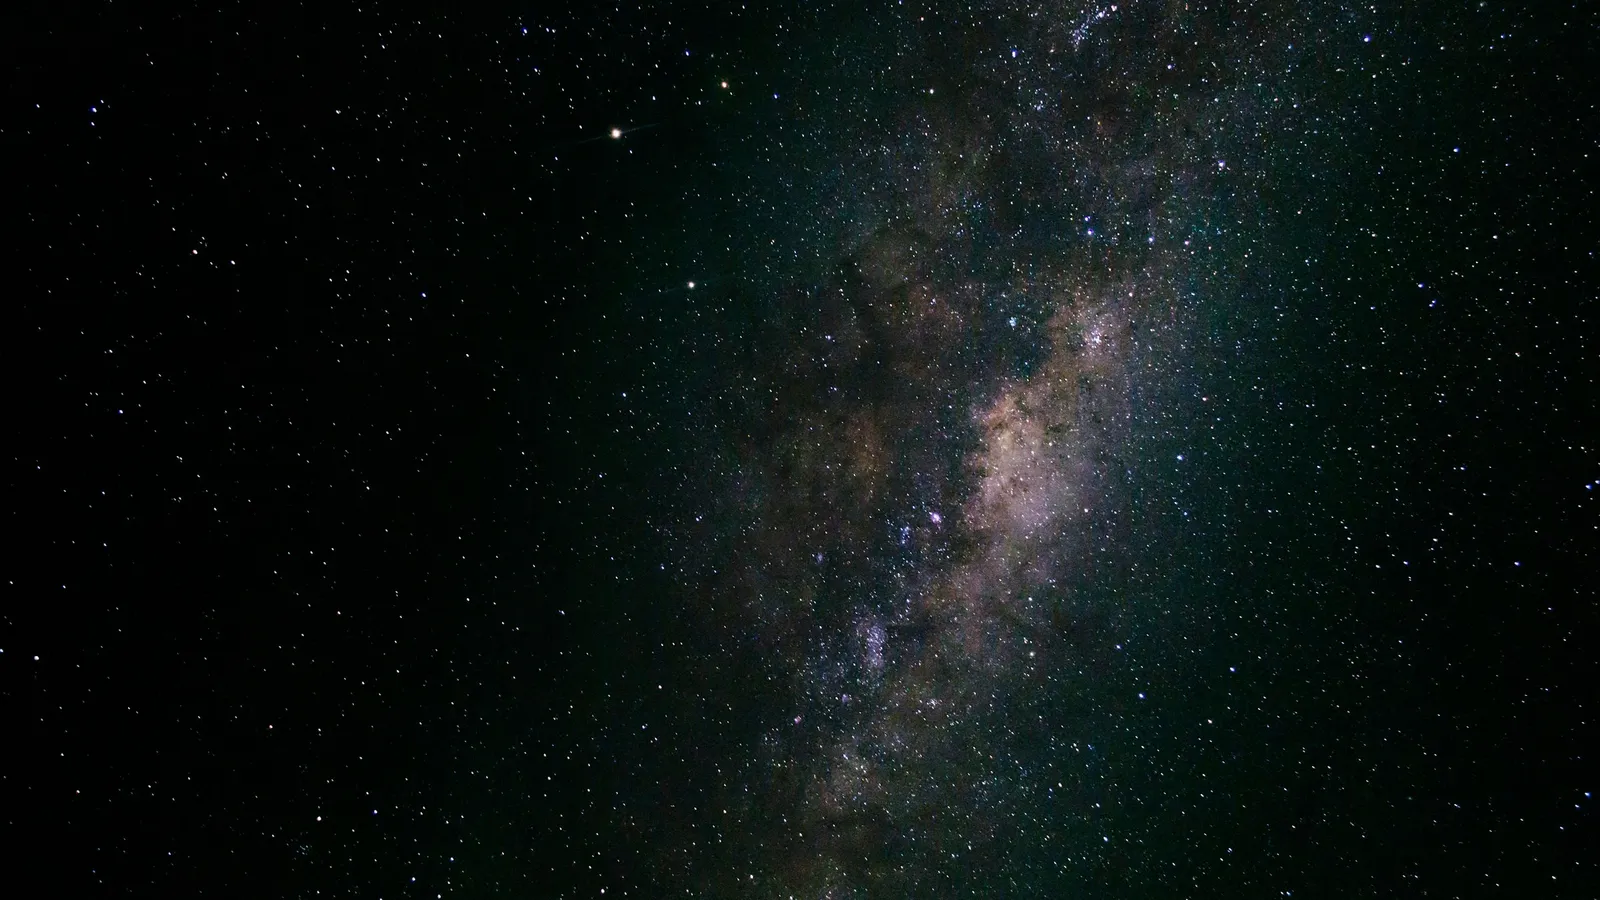
In November 1989, Margaret Geller and John Huchra published "Mapping the Universe" in Science (volume 246, pages 897-903). Their maps showed that galaxies are not sprinkled evenly through space. Many sit in thin sheets wrapped around huge empty regions, and the biggest sheet they found was the "Great Wall".
The Center for Astrophysics, where both worked, describes the Great Wall as a web of galaxies with a length of more than 500 million light years, identified by Geller and Huchra in 1989. The same page says they were the first to create a dense map of the three-dimensional distribution of galaxies for a significant volume of the universe.
Who were Margaret Geller and John Huchra?
Geller was born in 1947 in Ithaca, New York, and earned her PhD at Princeton under James Peebles, according to her Wikipedia biography. In 2014 the German Astronomical Society gave her its Karl Schwarzschild Medal, and the CfA announcement calls her a pioneer in mapping the large-scale structure of the universe.
Huchra was born in 1948 in Jersey City and died in 2010. His Physics Today obituary says he worked with Geller for 25 years and served as president of the American Astronomical Society from 2008 to 2010.
How do you map where galaxies are?
A photo of the sky gives a galaxy's direction but not its distance. The trick is the redshift: light from a receding galaxy is stretched to longer wavelengths, and the speed this implies grows with distance. The history is in our posts on Vesto Slipher's first galaxy redshifts and Edwin Hubble's evidence that the universe is expanding.
The second CfA Redshift Survey (CfA2) did this galaxy by galaxy. Huchra's own CfA Redshift Survey page says the team measured redshifts for about 18,000 bright galaxies in the northern sky between 1985 and 1995; its sky map shows galaxies brighter than apparent blue magnitude 15.5.
The first big surprise came in 1986. Valerie de Lapparent, Geller and Huchra plotted the redshifts of the 1,100 brightest galaxies in a strip of sky, and Physics Today reported that the galaxies sat on the surfaces of bubble-like structures up to 50 megaparsecs across. The authors wrote that the distribution was "like a slice through the suds in the kitchen sink".
The plot is a wedge, often called a slice. You, on Earth, sit at the point. Angle around the point is direction on the sky (right ascension). Distance from the point is redshift velocity. Stack several slices and you get a 3D picture.
How big is the Great Wall?
The 1989 Science abstract gives the Great Wall a minimum extent of 60 h⁻¹ Mpc by 170 h⁻¹ Mpc. It also reports empty voids with a density typically 20 percent of the mean and diameters of 5000 km/s, found in every survey large enough to contain them.
Huchra's survey page describes the Wall as about 600 x 250 x 30 million light-years, "sort of like a giant quilt of galaxies across the sky", lying between 8 and 17 hours of right ascension and between 5,000 and 10,000 km/s.
Worked example: turn the 1989 numbers into light-years
Start from the 1989 figures of 60 and 170 h⁻¹ Mpc, plus two facts.
The Planck 2018 results give H₀ = 67.4 km/s per Mpc, so h = 0.674.
One parsec is 3.26 light-years, so 1 Mpc is 3.26 million light-years.
Now work through it.
Remove h: 170 h⁻¹ Mpc = 170 / 0.674 = 252 Mpc. Likewise 60 / 0.674 = 89 Mpc.
Convert: 252 x 3.26 = about 822 million light-years, and 89 x 3.26 = about 290 million light-years.
Find how far away the Wall is using Hubble's law, d = v / H₀. At 5,000 km/s, d = 5,000 / 67.4 = 74 Mpc, about 242 million light-years. At 10,000 km/s, d = 148 Mpc, about 484 million light-years.
Sense-check: both lengths are "minimum" sizes, so a figure above 500 million light-years fits the CfA description.
Published figures differ because they depend on the value of H₀ used and on where you decide the sheet ends. When two sources disagree, check the units and assumptions first.
Why did the Great Wall matter?
The 1989 abstract ends bluntly: "The frequent occurrence of these structures is one of several serious challenges to our current understanding of the origin and evolution of the large-scale distribution of matter in the universe." In the CfA announcement of Geller's medal, Andreas Burkert, president of the German Astronomical Society, said the discovery "marked the starting point for many modern observational survey programs like the famous Sloan Digital Sky Survey".
If the link between redshift and speed still feels abstract, the Fermi Simulation Lab has interactive simulations for ideas that are easier to see than to read, and the Fermi Problem Library has worked problems with a step-by-step solver that explains the reasoning.
To see where the redshift method came from, read about Milton Humason's galaxy redshifts.