On this page
For decades, Hisako Koyama climbed to a rooftop dome in Tokyo's Ueno Park, pointed a telescope at the Sun and drew its spots by hand. Those sheets now help solar scientists measure the Sun's 11-year cycle, and anyone can look at them.
Who was Hisako Koyama?
Koyama was born in Tokyo in 1916 and became an amateur astronomer, a writer for amateur astronomy journals and a long-serving staff member of the National Museum of Nature and Science, according to a 2017 profile by Delores Knipp, Huixin Liu and Hisashi Hayakawa in the journal Space Weather. The American Geophysical Union's press release on that paper says she was making regular solar observations at the museum by 1946 and retired in 1981 at the age of 65.
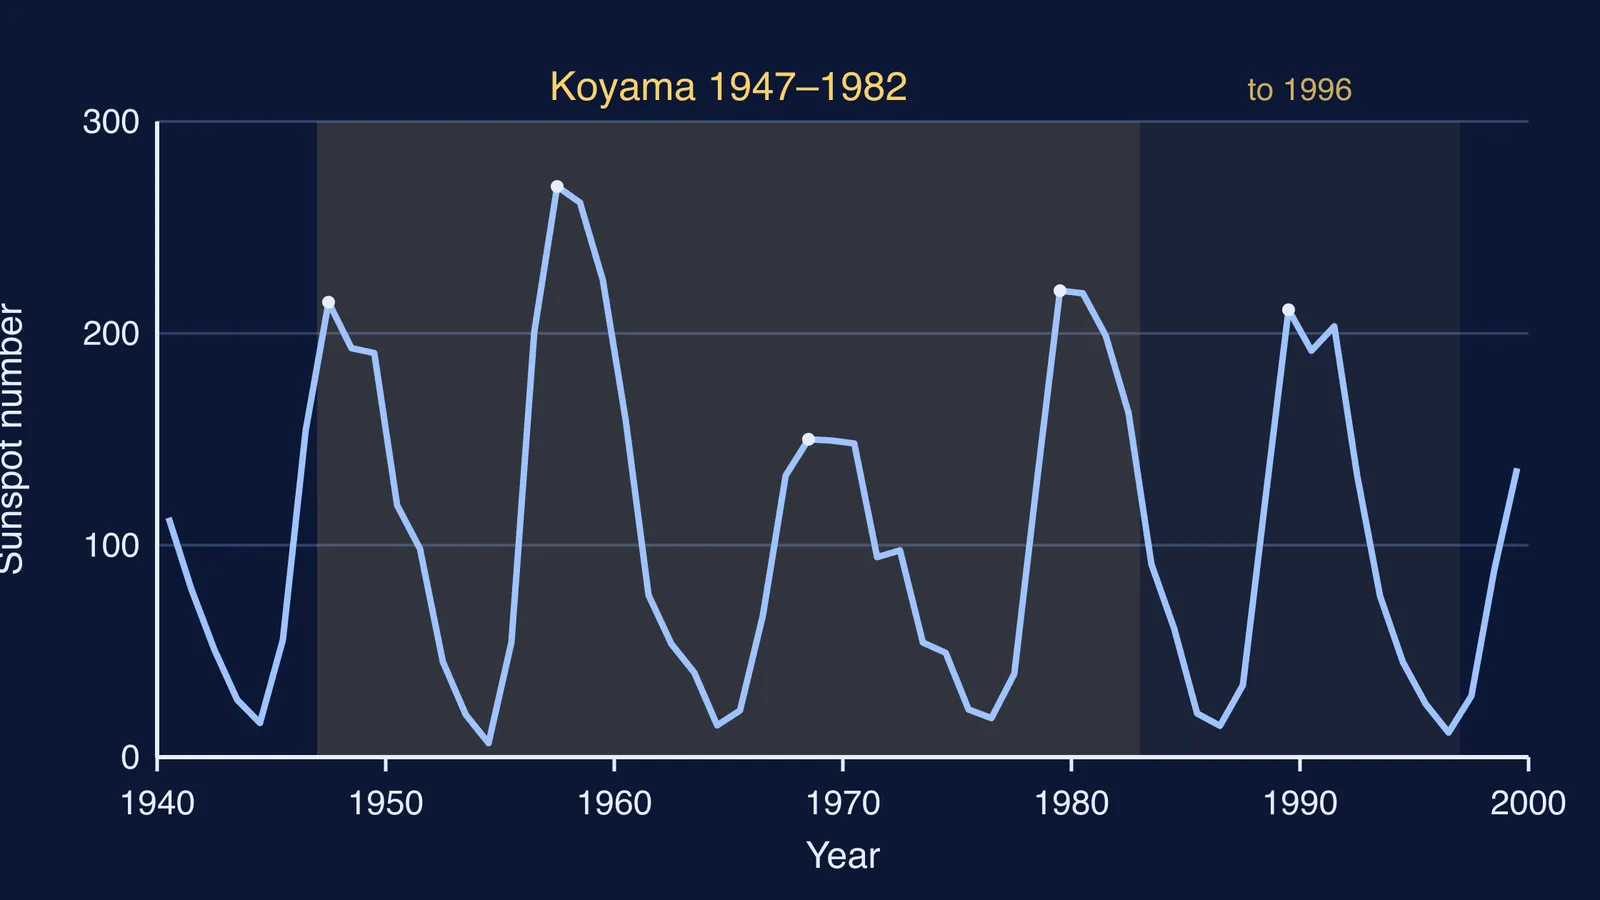
A 2020 study in Monthly Notices of the Royal Astronomical Society (free version on arXiv) found that she kept observing as a museum fellow, filling 50 handwritten logbooks up to 31 December 1996, over an observing career of 51 years.
How did Koyama draw sunspots?
For most of her career she used projection: the telescope throws an image of the Sun onto a white screen, and you trace the spots onto paper. The 2020 study gives the details:
Her earliest drawings in the museum archive date from 6 September 1945, made by looking through her own 3-cm telescope.
From May 1946 she projected the Sun with the museum's 20-cm refractor, first as a 10-cm disc.
From 22 January 1947 she enlarged the projected disc to 30 cm across, and this set-up became the standard instrument for her series.
For each day she logged the time, the number of sunspot groups and of individual spots for each hemisphere, and the seeing (how steady the air was).
She sent monthly reports to the Swiss Federal Observatory in Zurich and the Royal Observatory of Belgium in Brussels.
AGU's press release adds two highlights: in 1947 she sketched the largest sunspot of the 20th century, and in 1960 she saw a white-light solar flare while drawing. It says she drew sunspots for more than 40 years and made more than 10,000 solar sketches in her lifetime.
The database is on the museum's website.
Why do scientists still use Koyama's drawings?
The sunspot record starts in 1610 and is one of the longest-running experiments in science, says the 2020 study. But it was made by many people with different telescopes and eyes, so scientists need a few long, steady "reference observers" to compare everyone else against.
Koyama is one of them. Her drawings are one of the "backbones" of the recent international recalibration of the sunspot record, which reaches back to the early 1600s, according to Knipp and colleagues. AGU says her record bridged a gap between early 20th-century records and those of the space age. The 2020 study lists Schwabe among the other key observers; read how Heinrich Schwabe discovered the sunspot cycle.
The 2020 team checked her counts against the international sunspot number. They found her series stable from 1947 to 1982, and a 9% downward shift after 1983 that coincided with replacement observers making some of the observations, as reported in MNRAS.
How can you count sunspots like Koyama?
Koyama's logbooks recorded the Wolf number, R = 10g + f, where g is the number of sunspot groups and f is the number of individual spots, as defined in the 2020 study. Try it on an imaginary drawing.
Count the groups. Say you see three clusters: g = 3.
Count every spot inside them. Say 4, 7 and 1: f = 12.
Work it out: R = 10 × 3 + 12 = 42.
Now a single lonely spot appears elsewhere. It is a new group, so g = 4 and f = 13, giving R = 53. One small dot added 11.
To make your own drawings, use projection only, onto white card held behind a small telescope or binoculars, and never put your eye to the eyepiece. Our guide to watching a solar eclipse safely covers the same safe habits.
SILSO's daily and yearly numbers are on its data files page.
What can a student learn from a 40-year record?
Koyama's sheets look simple; their power is that they were made in much the same way for decades. For another observer who built a long sunspot record, read Annie Maunder and the butterfly diagram.
If the physics of why sunspots appear, or why the cycle rises and falls, is the part that feels fuzzy, the Fermi Concept Library has a lesson for each idea in physics and shows where it fits on the map. Then pick a clear morning, set up your card and start your own logbook.